Vantage Blog
Soil Moisture Comparison
2025-02-12
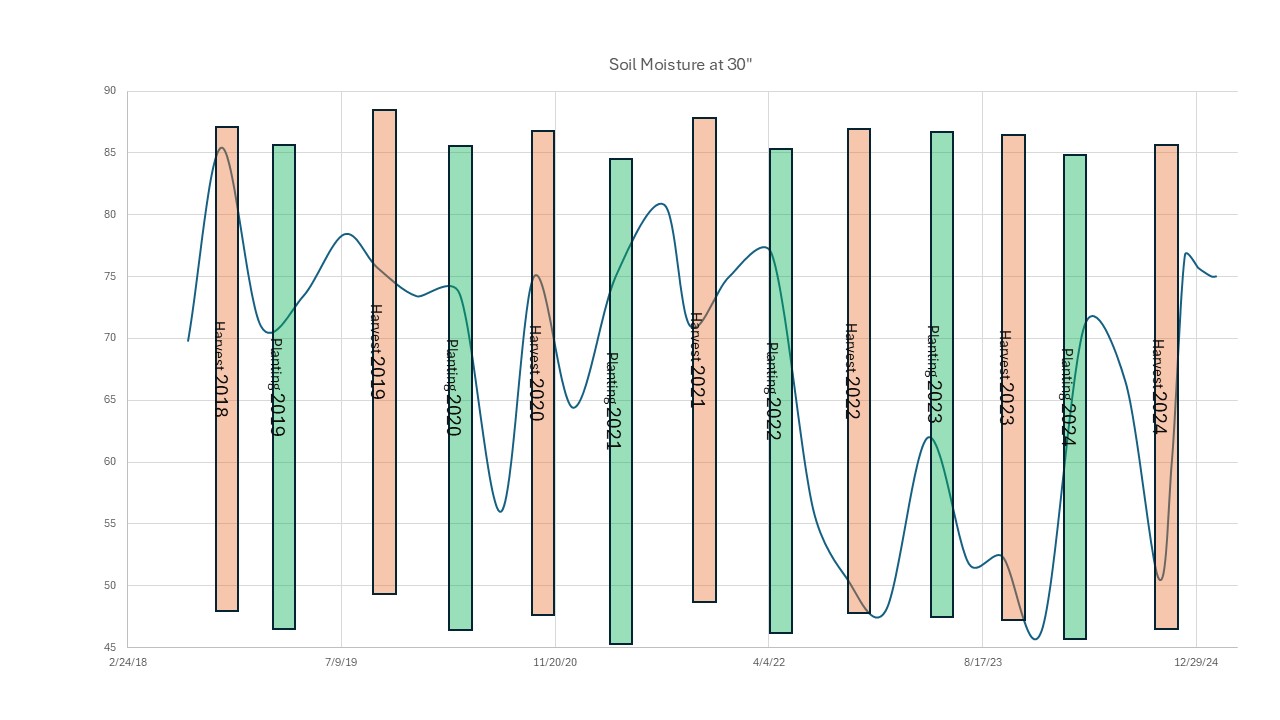
A couple years back we took a look at seasonal trends of soil moisture (scroll to 1/20/2023 post). Post harvest 2024 left us in pretty desperate shape. Although we've only received about 2" of rain since harvest, it seems to have been effective. Keep in mind, our deepest measurement is at less than 3'.
We're coming into our 3rd consecutive year with periods of severely dry subsoil. Soil moisture deeper than 3' is likely severely depleted for most upland soils.
Although we have fair moisture conditions heading into planting, growers should go into this season with a plan to address additional drought stress. Consider pest concerns from the past couple years - drought stress opens the door for fungal and insect pests to cause greater damage.
Nutrient deficiencies rear there symptoms when drought stress occurs - consider in-season foliar or top dress applications to cover these stressors in fields where you may not have a complete nutrient build.
Ready to Take the Heat?
2023-07-21
It’s been a standoff with soil moisture all year long. Even with some pretty significant rainfall events we have not pushed an appreciable amount of moisture deeper than 30 inches. Soil moisture conditions at the end of June left us within a few days of catastrophic crop loss. Even with the lack of precipitation and reserve of soil moisture, crops still look good.
Years like this with extended drought periods often reveal weaknesses in fields that moisture can mask. In early June we observed fields showing symptoms of drought induced potassium deficiency on very immature corn. Those symptoms were showing up significantly earlier than we would typically see. We noticed the symptoms were more evident on fields with dry, glacial till hillsides and in fields where regular potash application has not occurred.
For most fields, the cooler and dry conditions early, slowed vegetative growth. Based on our soil moisture monitoring, the soil profile was at or near the wilting point at 30” by late-June. Crops were likely scavenging moisture from above that depth in areas with higher nutrient concentrations. As the crops waited for the precipitation events we had in July, fields with good nutrient application were sitting with nutrient dense plants ready for moisture.
Regular cloud cover and smoke from Canadian fires typically would be a curse to a crop because of the negative impact on photosynthesis. This year it may be a blessing to have slowed evapotranspiration rates as we try to extend plants from one rain event to the next.
As we head into the coming week with high temperatures and a once-again depleted soil moisture profile, expect crop weaknesses to show up again. If the heat and drought continues, fertility, fungus treatment, and complete weed suppression may not prevent crop loss. But an appropriate fertility program, with adequate seed and plant treatments may just buy an additional couple days or week to get to the next rain event to save it.
Corn Borer - GDD for Scouting
2023-06-17
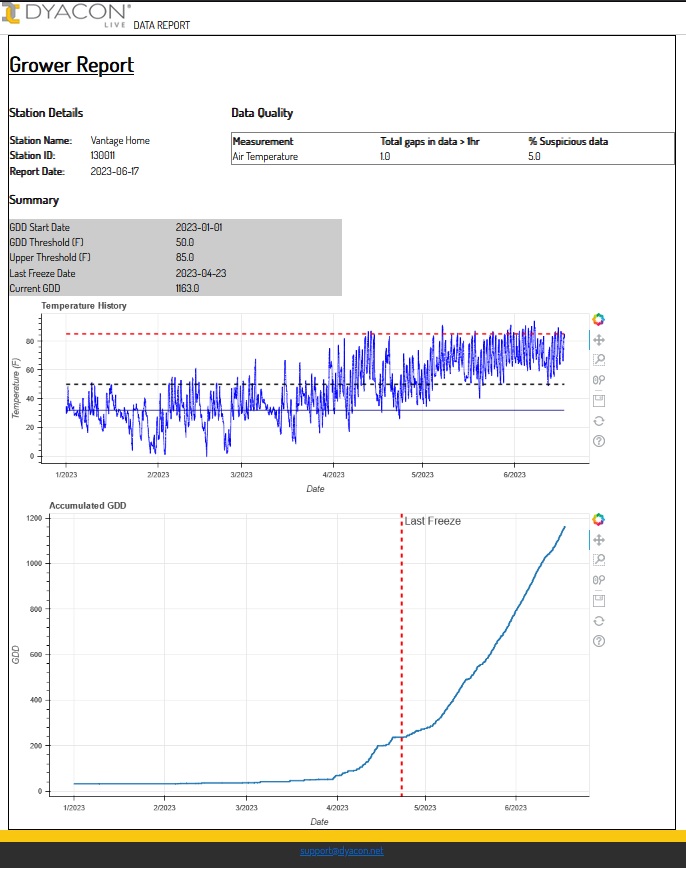
The European corn borer (ECB) can be a serious pest of corn in Nebraska. Corn borers overwinter as full-grown larvae in corn stubble. Temperature plays a major role in determining the rate of corn borer development. The European corn borer has a 50° to 85°F temperature range at which it is most comfortable. Below 50°F it will not develop, and above 85°F development will slow dramatically.p>
Using the temperature window of 50° to 85°F, we’ve been tracking growing degree days (GDD) to estimate the life cycle progress of ECB in our area. We can estimate most of the first generation has taken flight, produced eggs, and about to peak in the 1st larval stage.
Now is the time to start scouting ECB in non-BT corn. Look for pin-holes on whorls – concentrate on the tallest corn in the field first. If you suspect ECB, contact us to figure out a treatment plan.
Soil Temperature Readings
2023-05-04
A quick note on soil temperature readings: You may have noticed a wide range in soil temperatures between weather station locations. While there are some temperature differences between sites due to soil type, cover, soil moisture, and latitude, the sites should be fairly consistent when operating properly.
Due to some damage from rodents, we had to replace probes on the Elmwood and Hwy 50 and 128 sites. The Douglas site was installed last year. Since the trench near the probes still have not fully settled, there is more air near the probes and these sites heat up faster. Additionally, a little bit of dirt work occurred over the Douglas probe leaving it less than 3” under the surface instead of the standard 4”.
For now, rely on the Home, Syracuse, Burr, and Union readings.
April Rain Report
2023-05-03
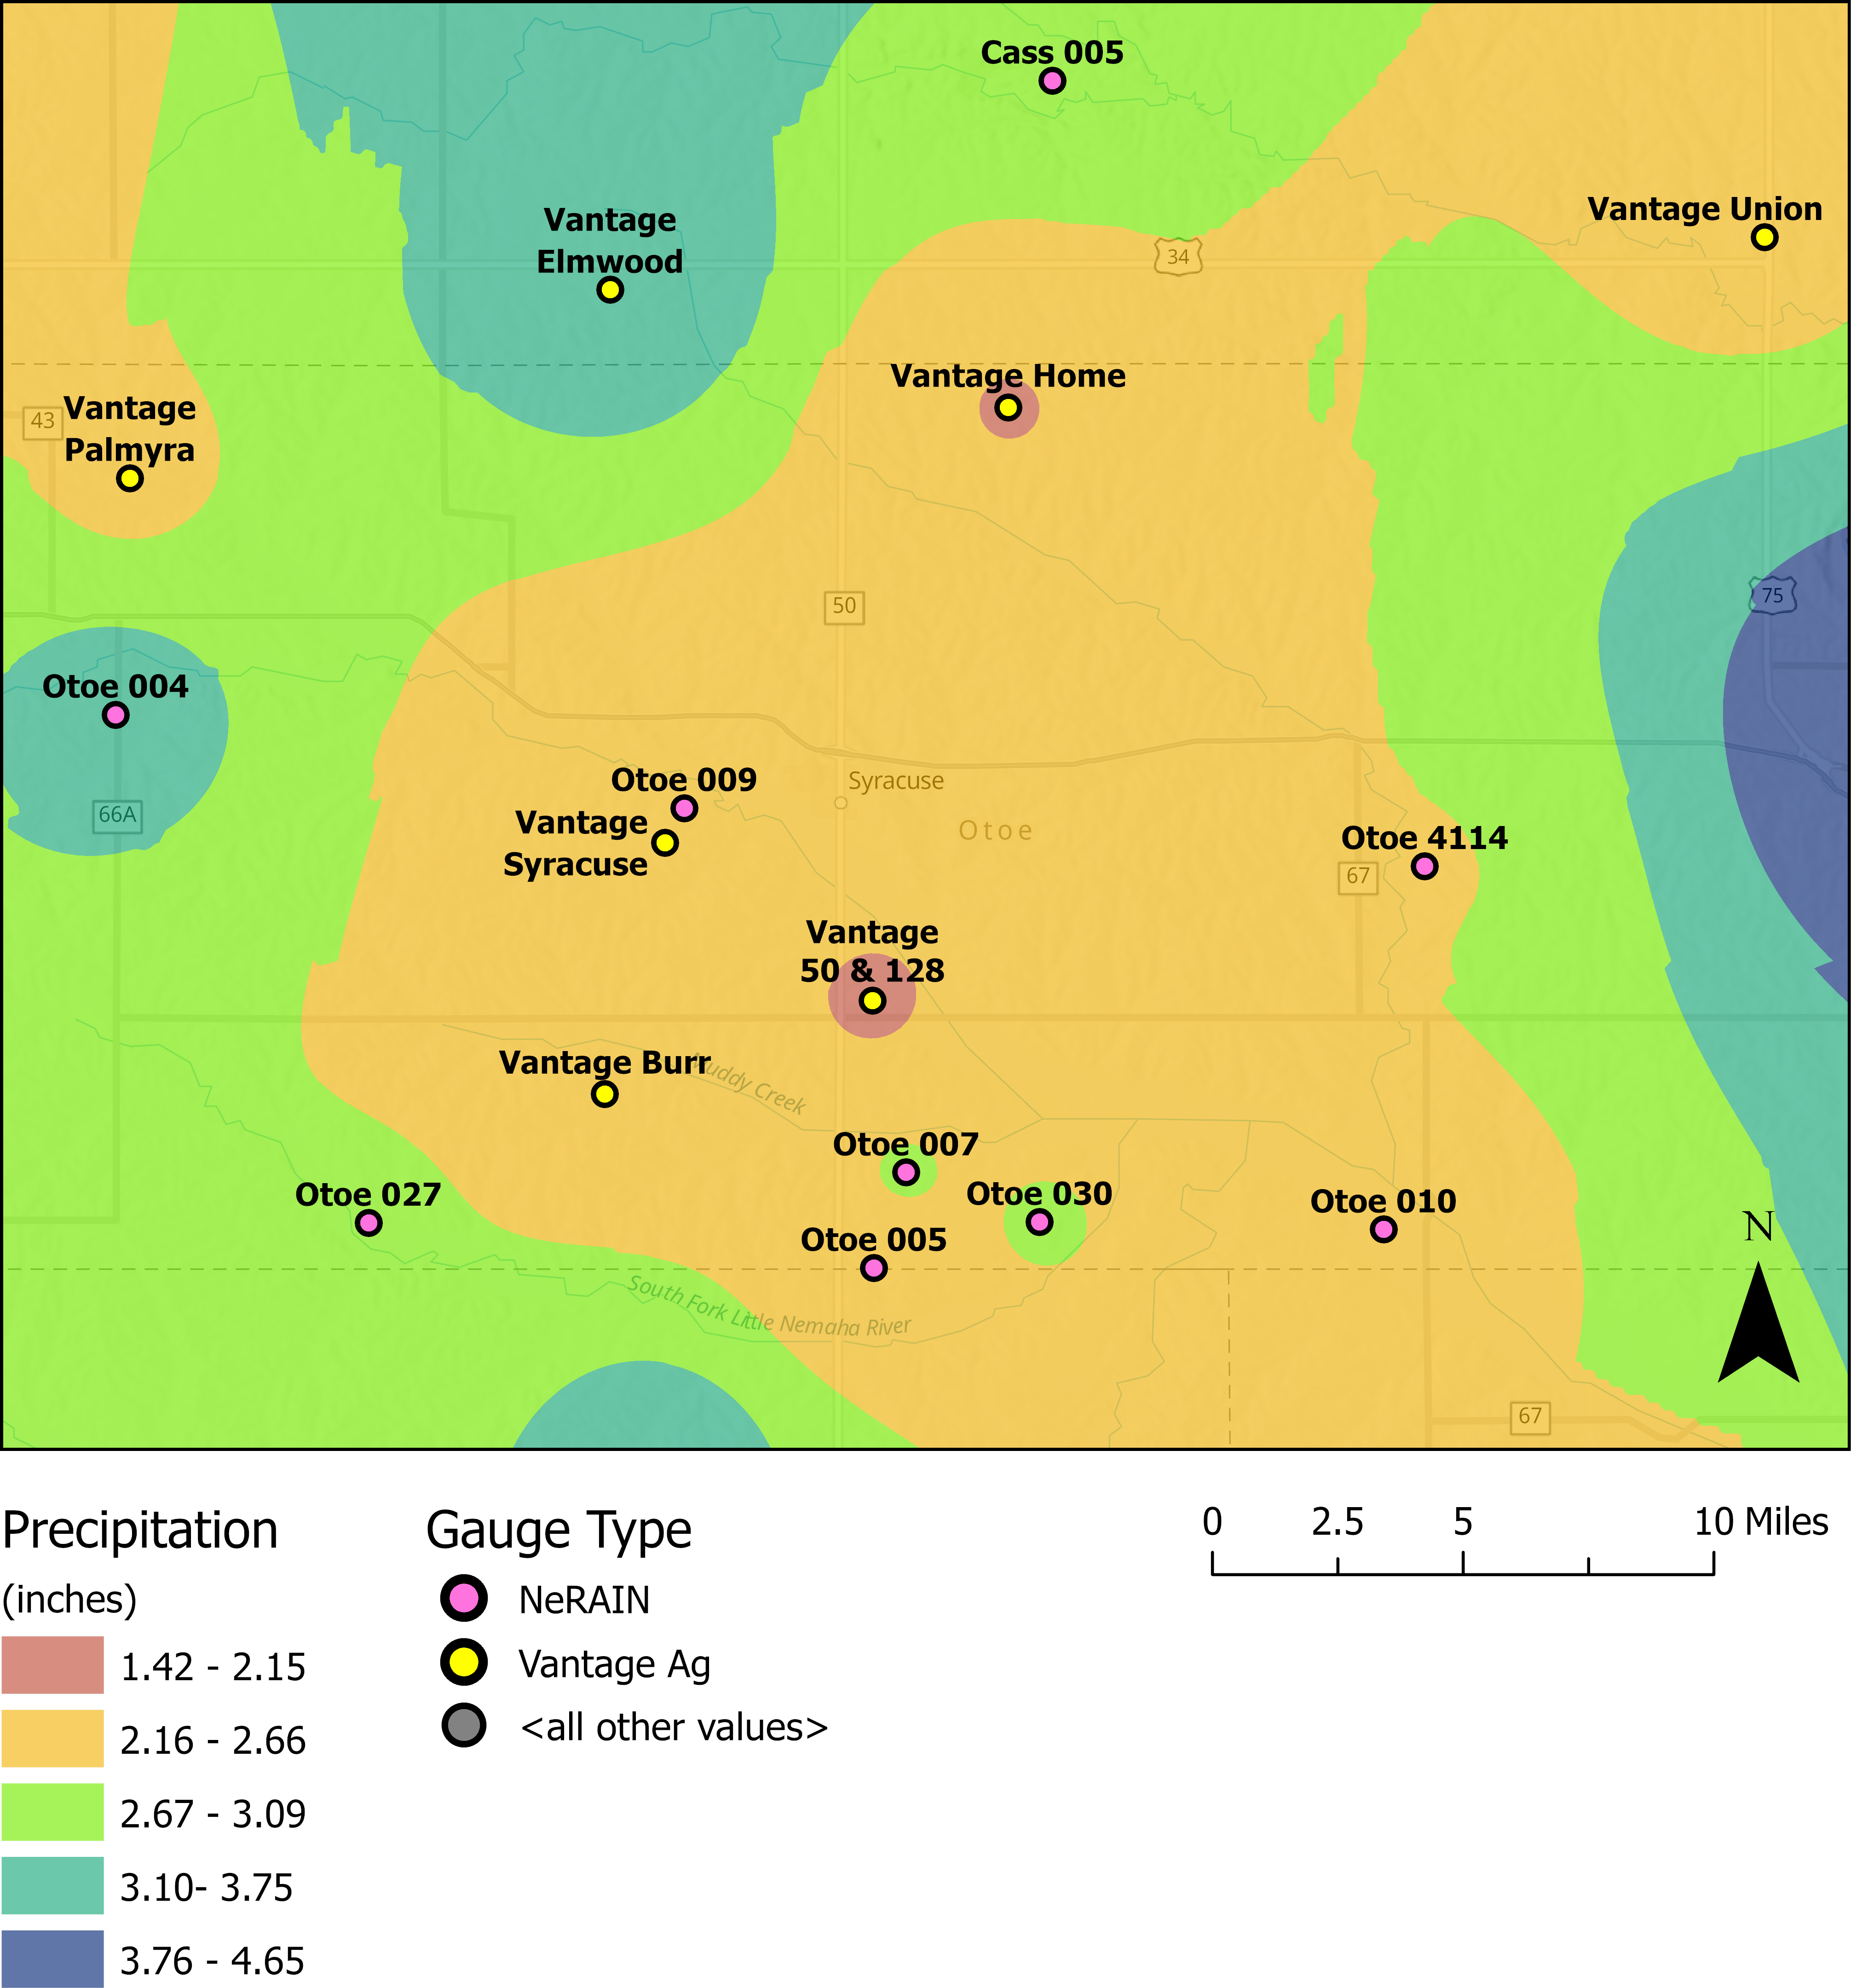
Average precipitation for the month of April (2.51”) fell about a half inch short of the 30-year average (3.01”) for Otoe County. This leaves us about 2” short on the year.
The mid-month rain finally provided enough moisture to be seen in the soil profile at 30”. That doesn’t mean we have a full profile; we’re still extremely dry with depleted subsoil. Unfortunately, with a 2-week dryspell, dry air, and high winds the soil moisture profile is starting to look like it did prior to April rains.
VR Seeding - Next Best Thing to Irrigation
2023-03-17
Varying corn seed rates, based on soil moisture, is likely the most impactful precision ag practice a grower can control. While fertility levels affect the whole field “top end” potential and low nutrients in parts of fields can impact yield, soil moisture management has a significantly greater impact to yield on dryland in Southeast Nebraska.
If irrigation is not available, the second-best tool is managing water demand through plant populations. Growers can do this manually by changing rates in different landscape positions, or take advantage of automated hydraulic/electric drives on planters to vary rates by soil type or more precise zones using GPS.
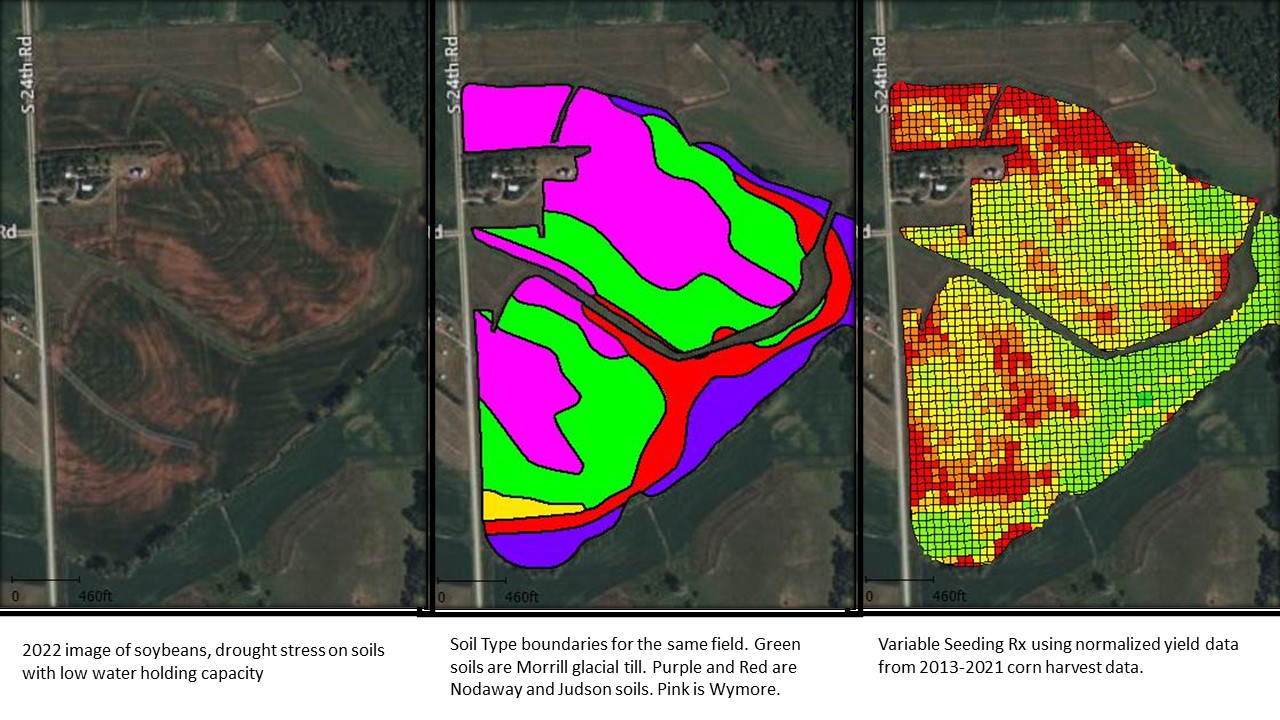
2022 aerial imagery of drought stress validates the use of USDA soil maps as a guide for variable rate seed prescriptions. The image above (left) shows “brown” areas where soybean canopy did not close. The middle image is a soils map for the same field; sandy till and outwash soils, with very low water holding capacity and poor infiltration, line up within the soil survey boundary lines. Using soil survey boundary lines is an accurate way to create a variable rate seeding prescription.
The image to the far right is a variable rate seed prescription we created using the grower’s historic yield data. By using the yield data, we can refine the VR Rx to add higher yielding inclusions (areas that hold or receive more water). The VR Rx on the right more closely follows all the contours that show up in the stress photo on the left than soil survey boundaries do.
There are a lot of options available for growers to create their own VR Rx and many of them are extremely easy to use, especially for creating soil survey based Rx. A couple of free options are the John Deere Operations Center (map.deere.com) and Case AFS Connect Farm App (farm-caseih.agdna.com).
Of course we have tools available to help growers get started with or without yield data. And we have been monitoring performance of variable rate seeding for nearly 10 years with growers in the area. If you have questions on minimum and maximum rates, good rates for different soil types, or other concerns with variable rate seed populations reach out to Zach.
Soil Moisture Status March
2023-03-08
We’ve been monitoring soil moisture throughout this winter with optimism that we would eventually see some recharge. In late January (scroll below), I posted a chart showing soil moisture at the 30” depth from the past 5 years to demonstrate how dry we are going into the growing season in the profile. When I posted that chart, the entire soil profile above 30” was just about as dry.
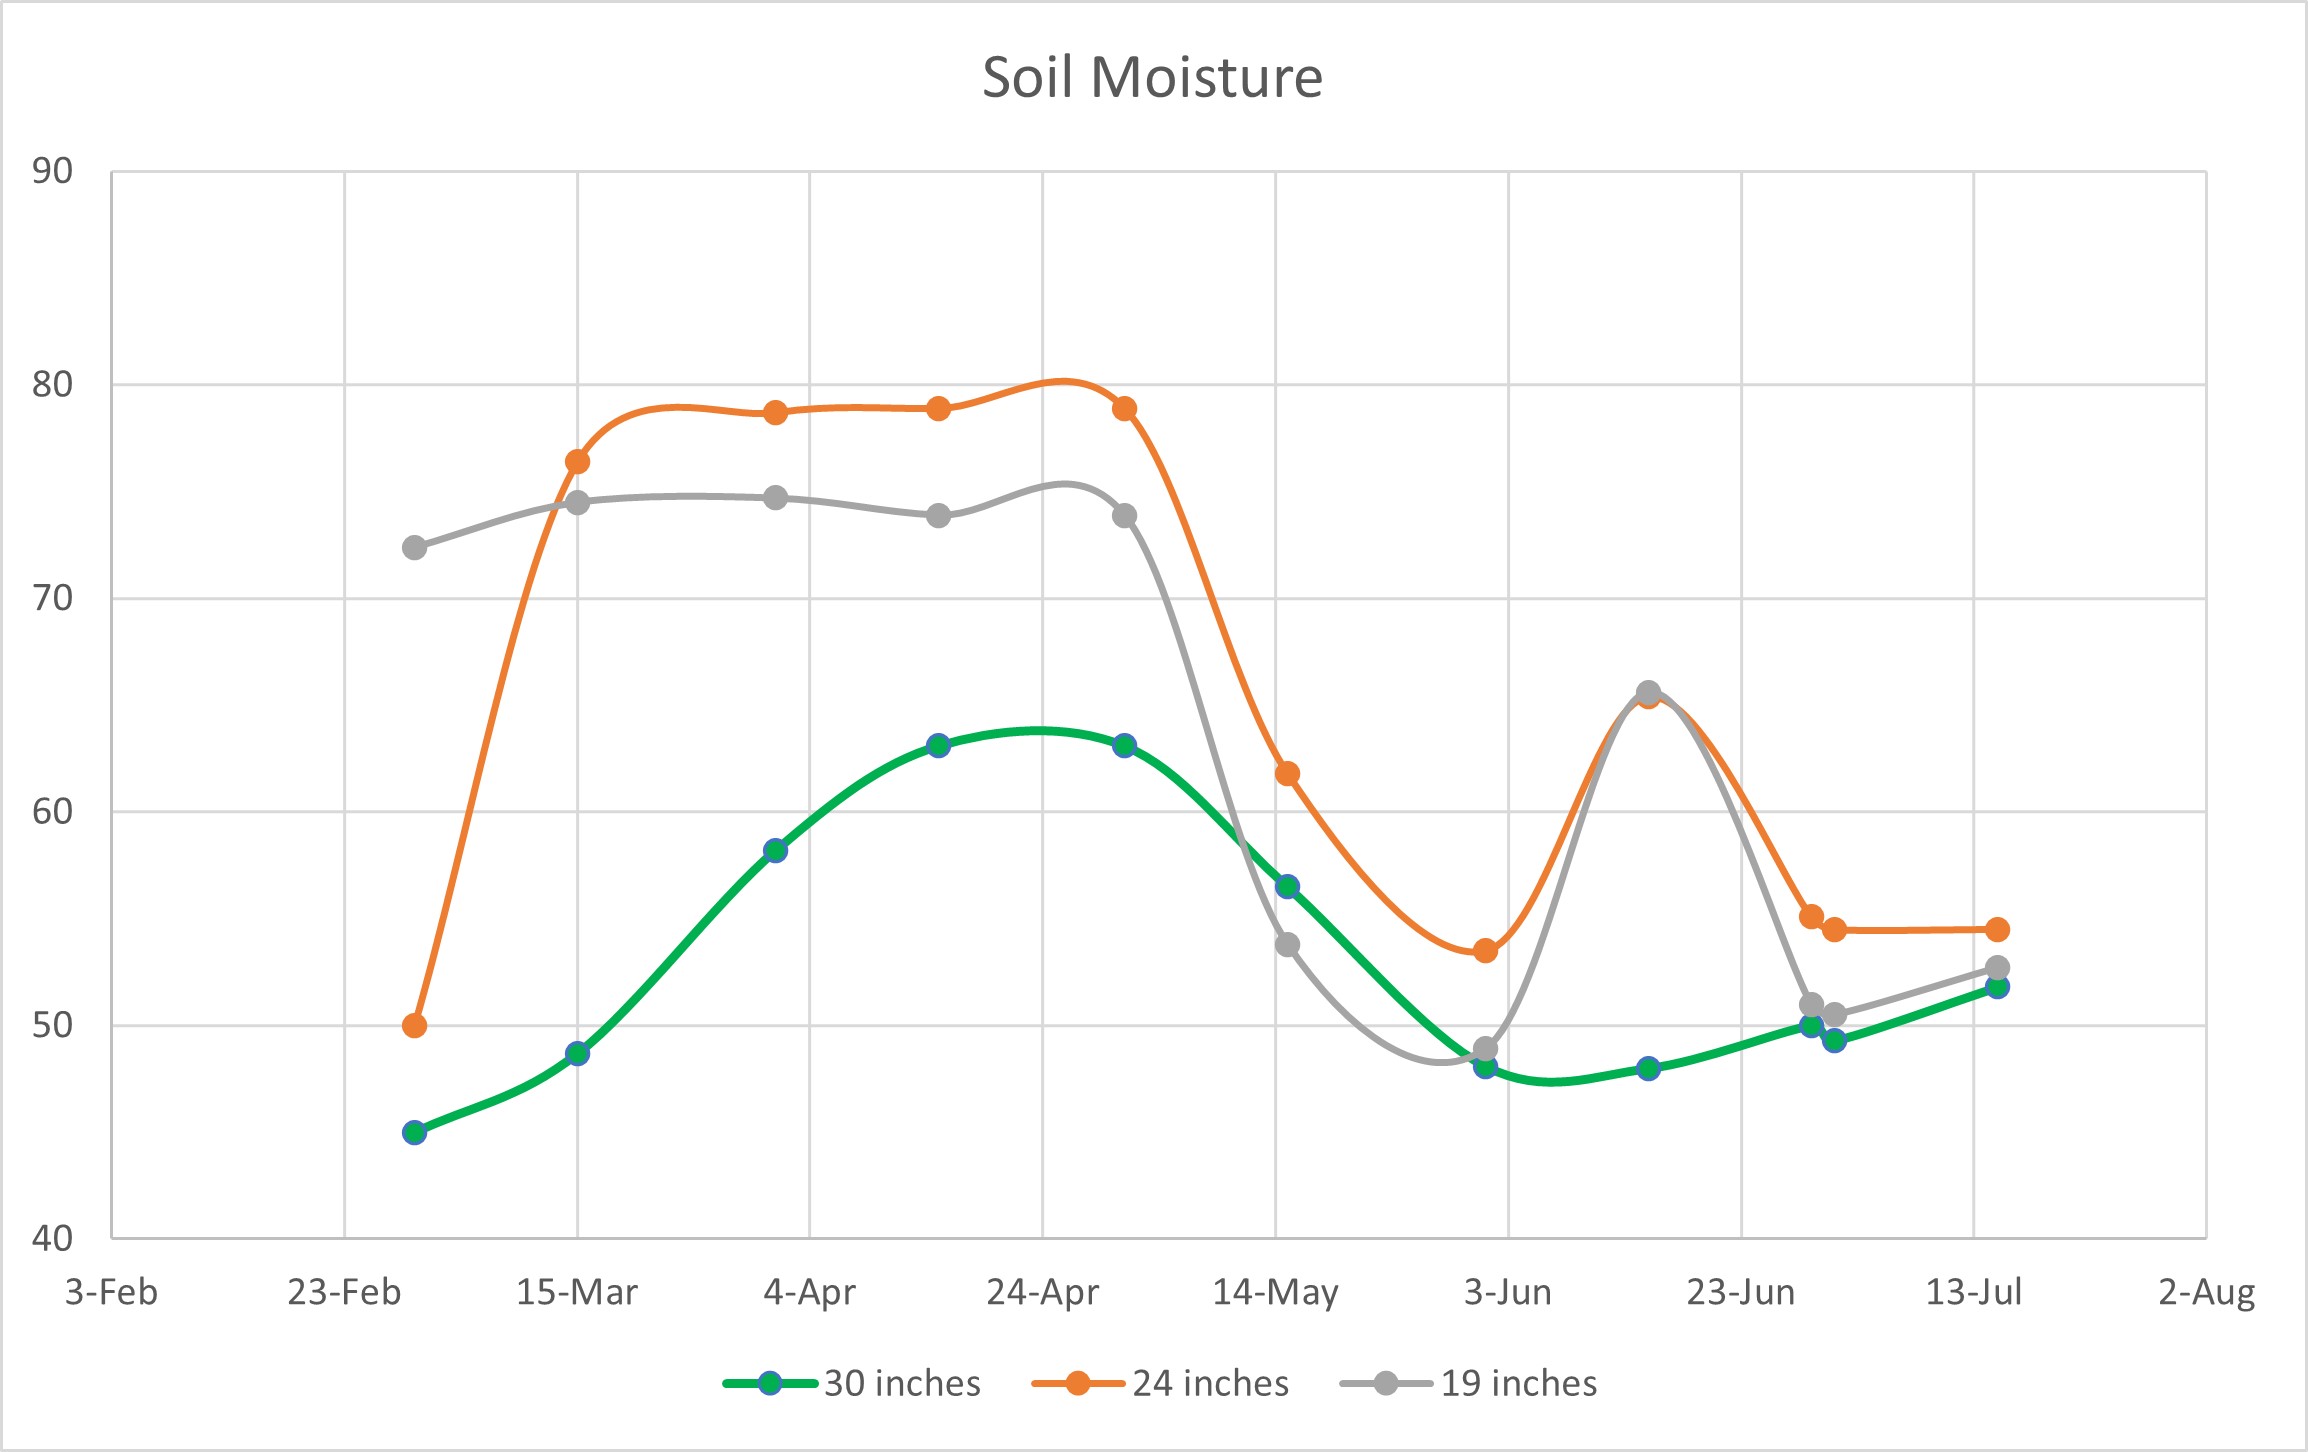
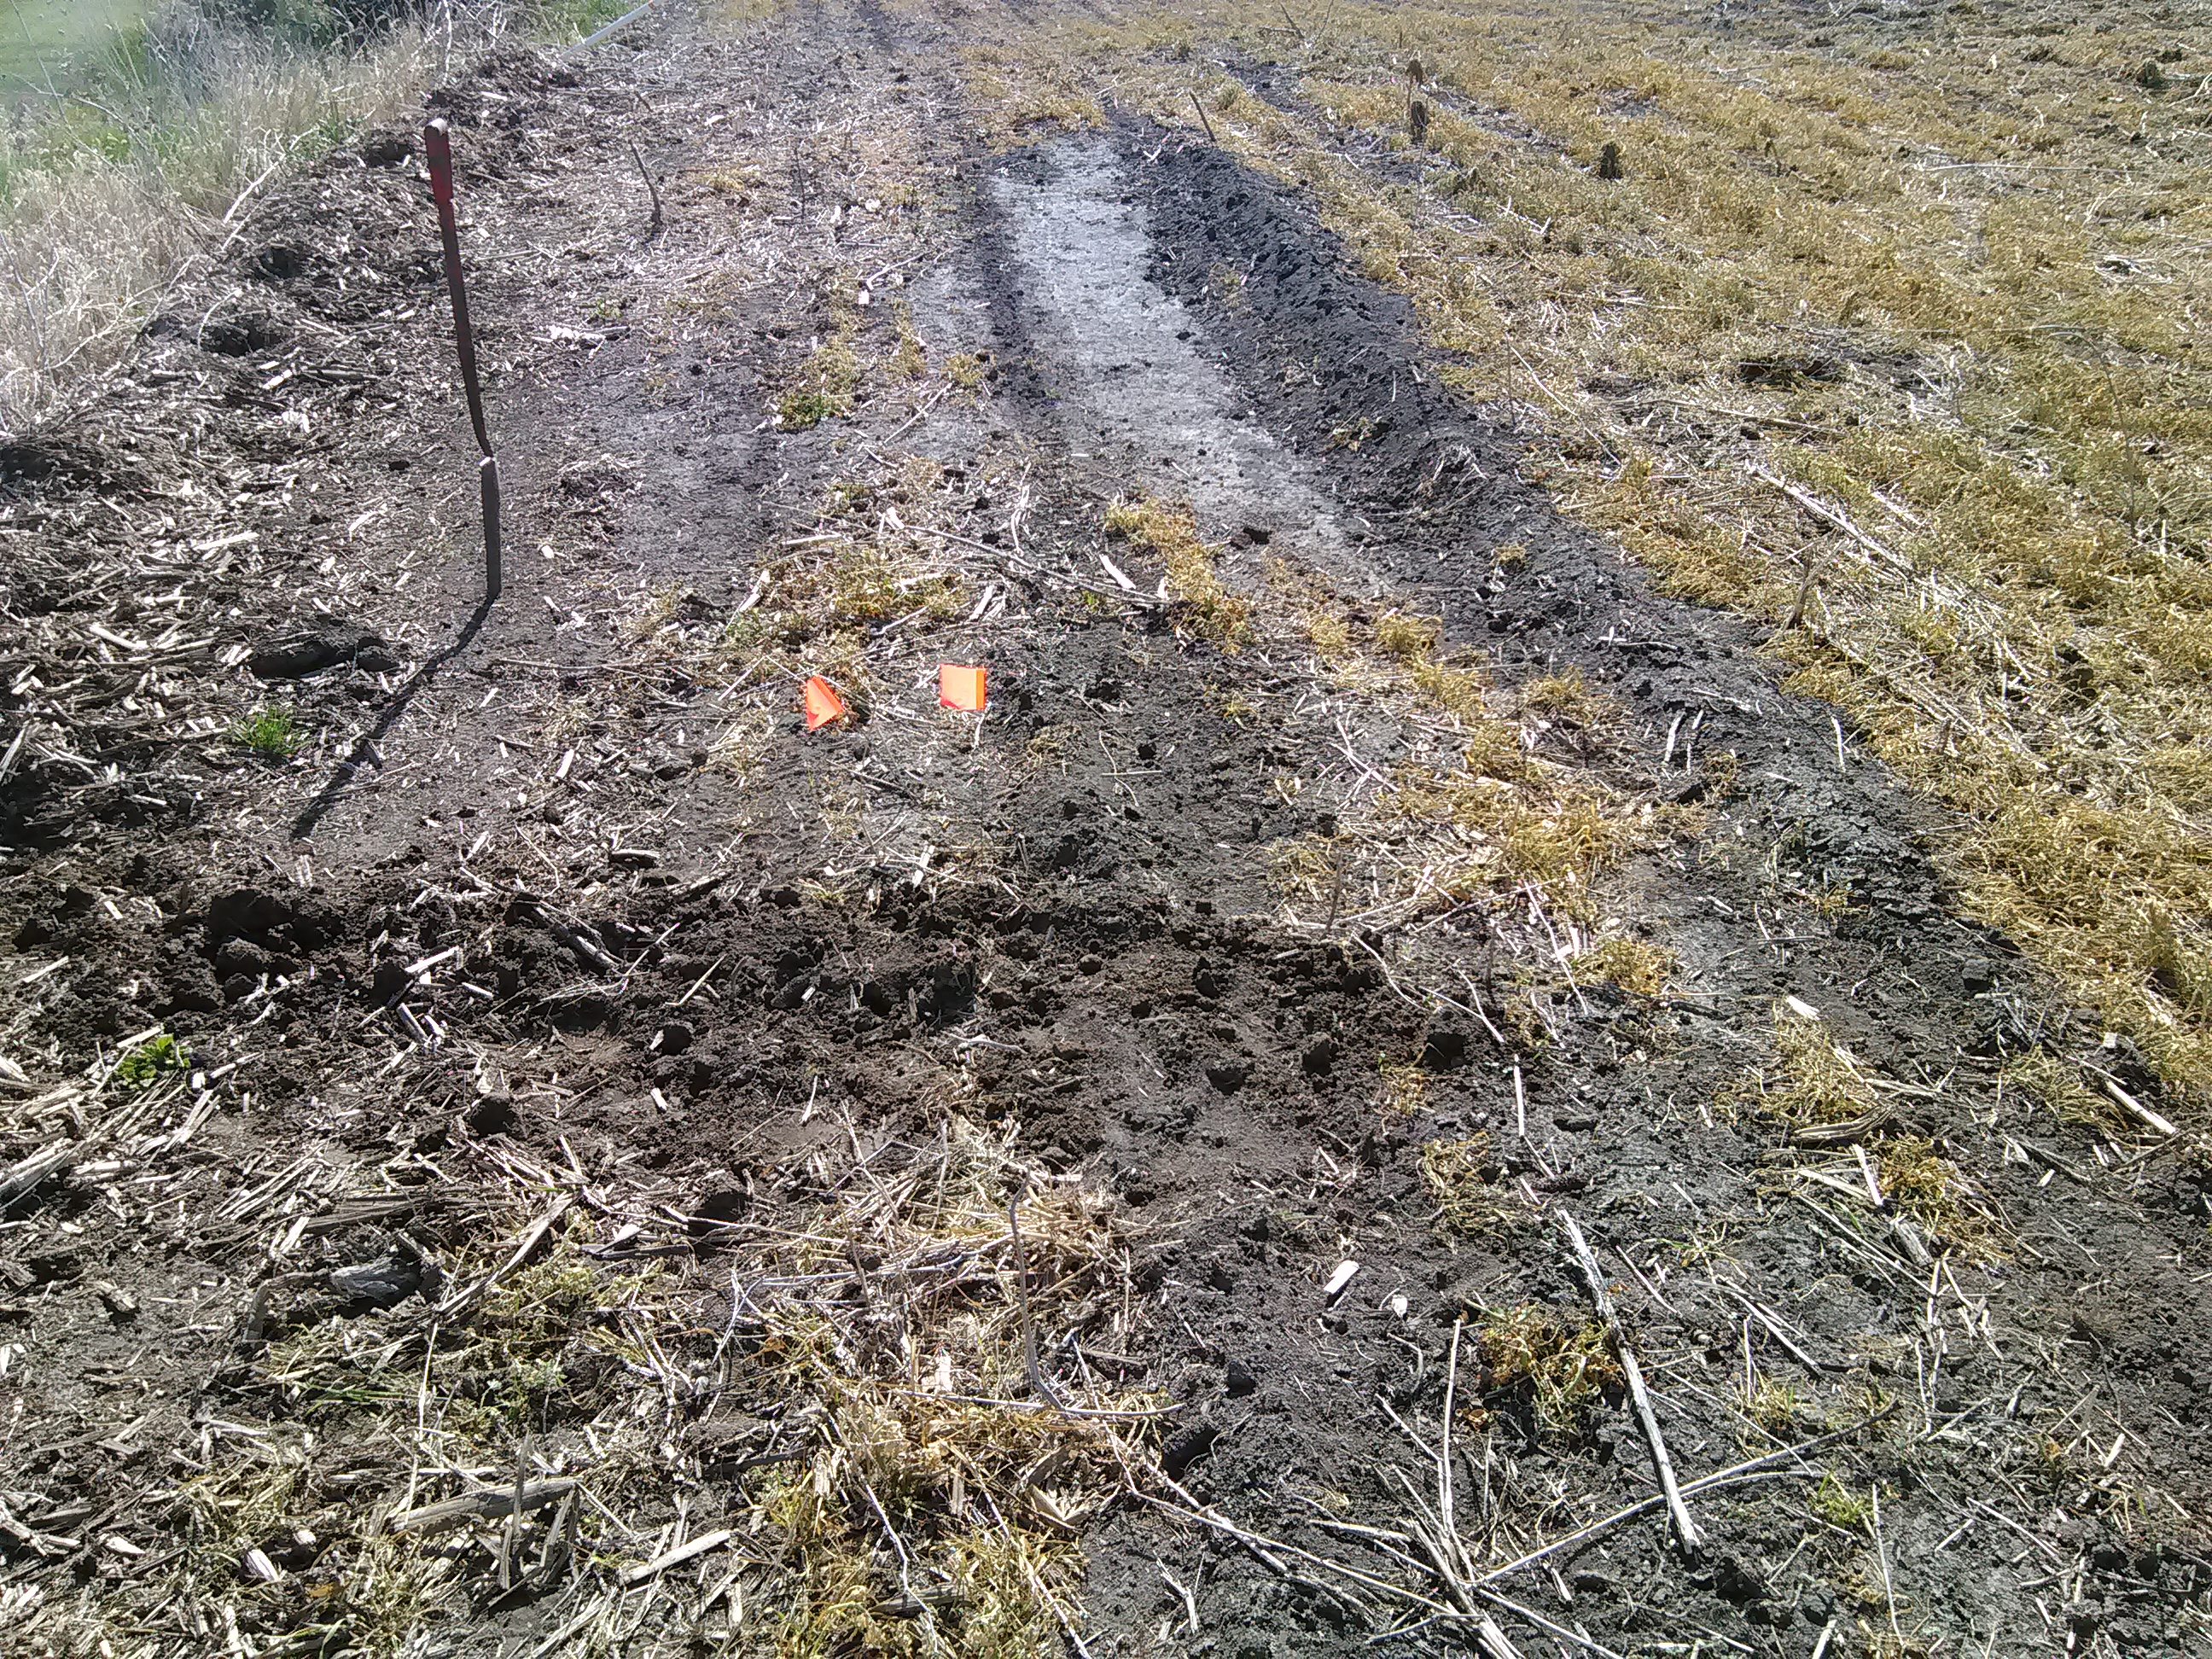
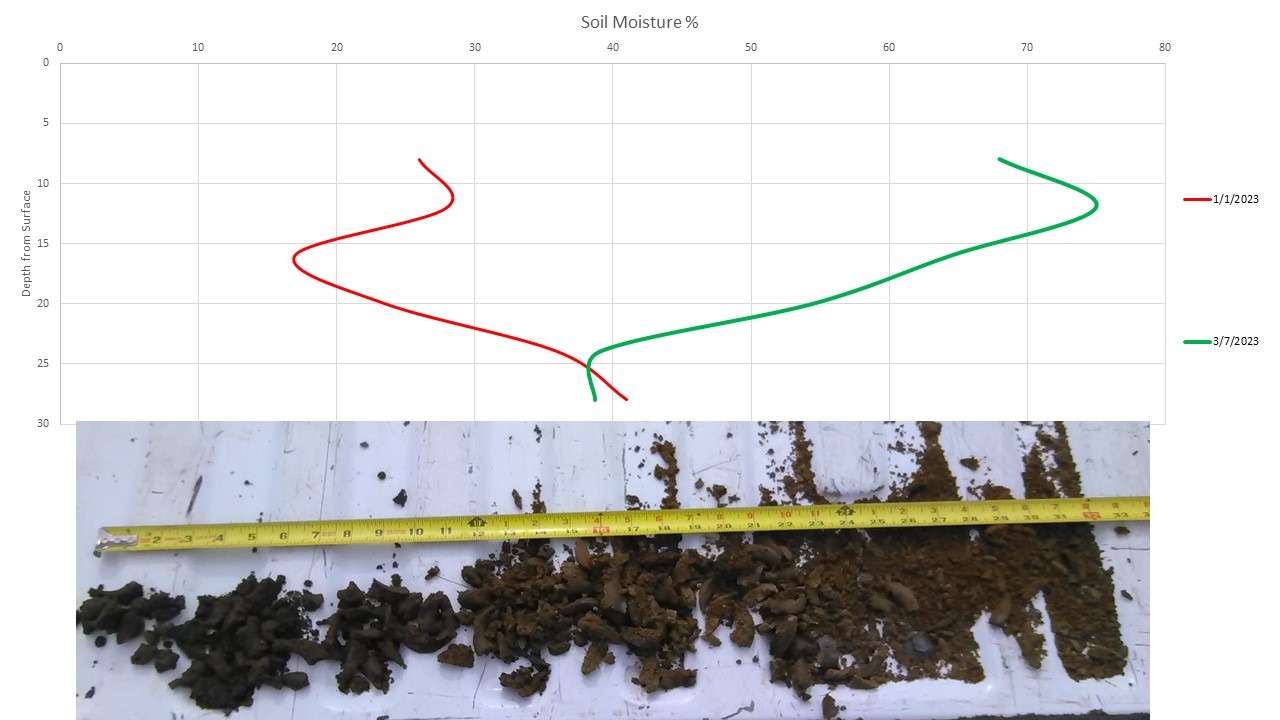
I pulled some soil cores yesterday to demonstrate what “dry” looks like compared to the charts. The graph above (Red line January 1, Green is March 7) shows that we have picked up some moisture in the top 20-24” of soil over winter. The picture that accompanies the graph shows a Pawnee soil from the surface (left) to about 32” (right). The top 24” has some moisture, enough to stick together and form ribbons. Below 24” we start to see an abrupt change, soil is too dry to even stick together.
One other observation worth noting is the soil moisture content at the 30” mark has continued to decline since the beginning of the year even with surface additions of moisture. This continued decline may be an indication of even dryer conditions deeper that are pulling moisture away from soils above.
Subsoil Moisture outlook for 2023
2023-01-20
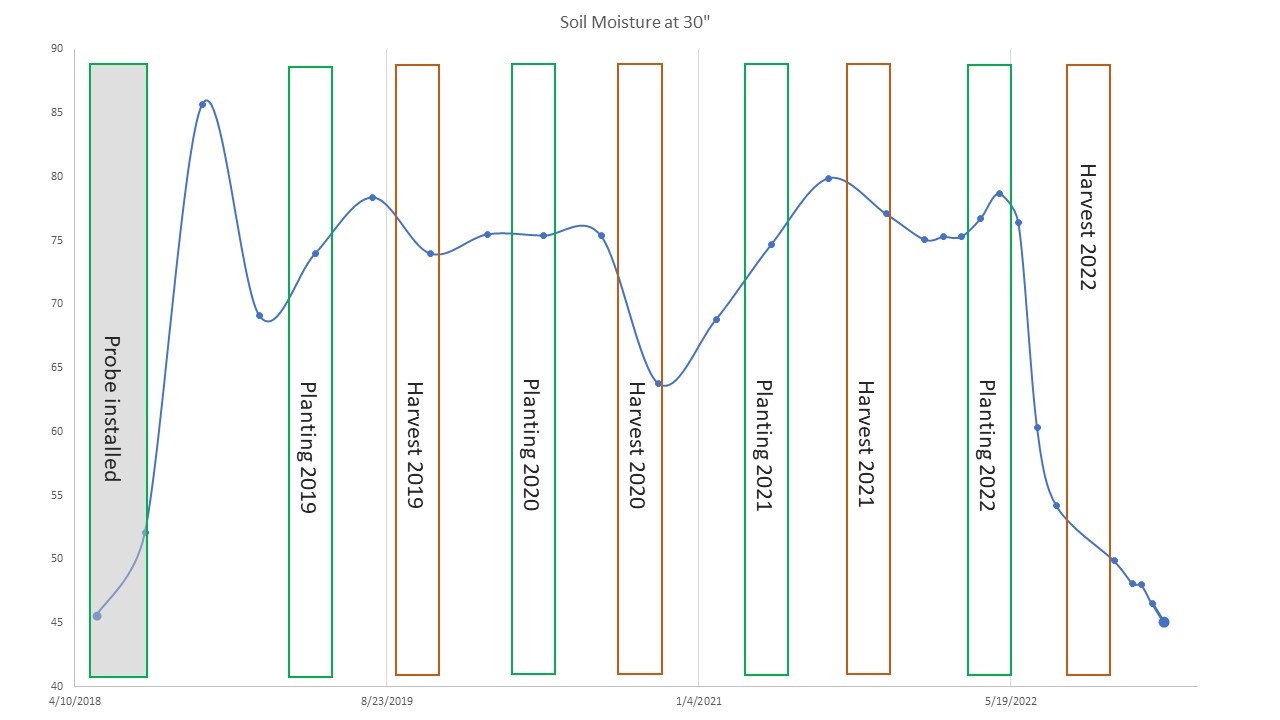
The chart above shows soil moisture from one of the sensors we have placed on a Wymore soil; the sensor is reading moisture at about 28”-34” below the surface. We’ve had this sensor in the ground since 2018 (the early 2018 reading is likely low from the probe needing to settle into the soil).
Since last Fall’s harvest we are continuing to detect a loss of soil moisture deeper in the profile. On our weather stations with a multi-depth soil moisture probe, the bottom sensor (#6) is measuring soil moisture at a depth of 28”-34”” below the soil surface.
With no live plants pulling out moisture, low temperatures and surface residue limiting evaporation, and 2.5” of precipitation received since harvest: how is the subsoil still getting dryer?
The most logical reason is that moisture is stabilizing in the entire soil profile. All the sensors below 8” have been as dry or even dryer than the 24” depth – if the soils above or below are dryer, water is going to try to wick and equalize moisture content.
We’ve received 2.5” of precipitation since November and that has only influenced moisture in the top 8”-12” of soil. In fact, I was still periodically hitting dusty, dry soil at 6” when soil sampling in early January. Our sensors are showing decrease in soil moisture at 16”, 20”, 24”, and 30”. If the moisture additions from the surface is not enough to slow or reverse the subsoil moisture loss to 30” – it must be significantly dryer below 30”!
This is a concern to be aware of for planning in 2023. Growers should take some extra time to evaluate soil types for each field. Fields with 20% or more of the farmed acres a Morrill, Shelby, Pawnee, Steinauer, Dickenson, Kipson, or steeper than 10% slope soil type should consider “tough”, drought resistant hybrids. Web Soil Survey
Finally, if you have technology to vary seed rates, then do so. Either based on soil types or historic yield data, reduce seed rates on steeper ground and with clayey soils.
While 2022 corn yields were disappointing to many growers, it’s amazing how many fields sustained harvestable yields considering precipitation effectively shut off mid-July. Some hybrids and some soil types provided access to subsoil moisture to sustain the crop.
For 2023 growers should exercise what little control they have over moisture management:
- keep residue cover
- select appropriate genetics
- manage plant populations
- eliminate weed competition.
Micronutrients: Boron
2023-01-09
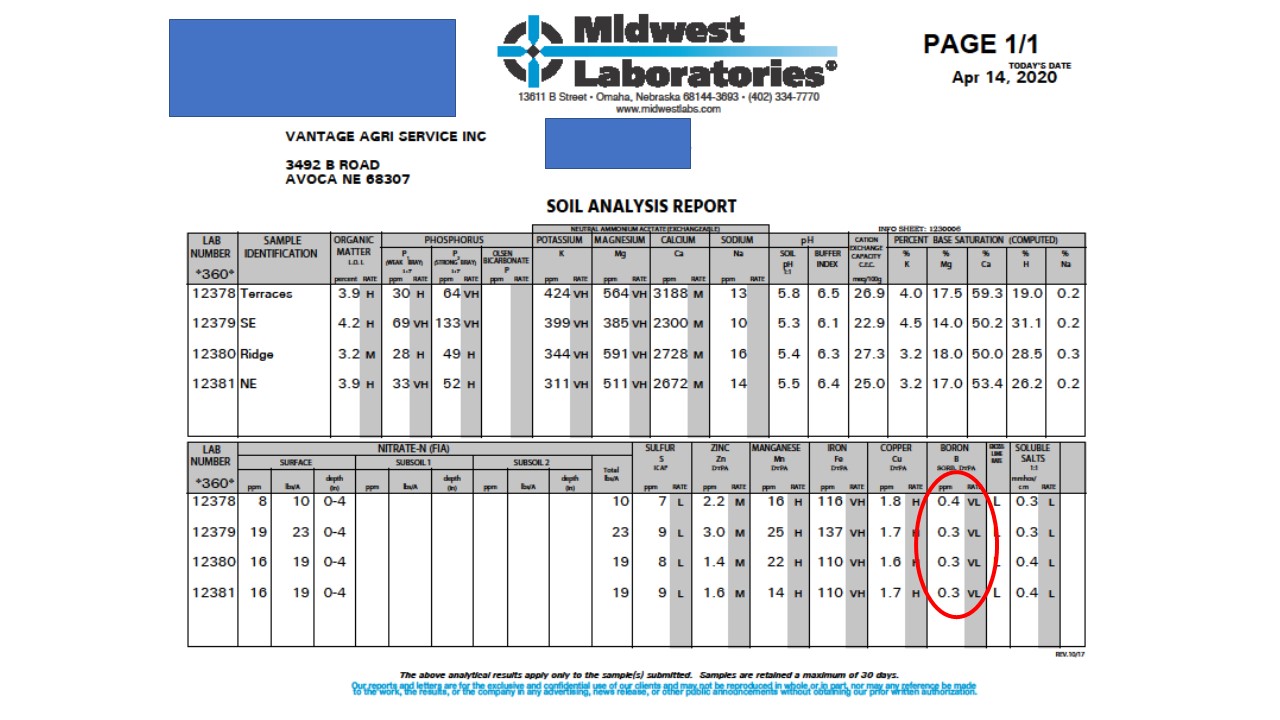
There is about 100% chance that your soil test Boron values are low. In the past couple of years, we have run Boron analysis on 88 soil samples and all 88 indicate Boron values are low (87 of them under 0.5 ppm!). Low soil test B values don’t necessarily equate to B deficiency. In fact, in the past 5 years, we have run plant tissue Boron analysis on 154 samples and only 36 of those samples were in a deficiency range; keep in mind many of the plant tissue samples were sent in on unhealthy looking plants we were trying to diagnose.
Soil sampling and analysis does a poor job at predicting the need for Boron fertilization and poorly correlates with crop Boron uptake. Organic matter is a large pool of available Boron; most of our soils have inherently high levels of organic matter in no-till systems – we just need the moisture conditions to mineralize and release B to soil solution. Soil tests don’t pick up on the potentially available B in organic matter.
Boron is mobile in the soil and can leach, but not as readily as Nitrates or Sulfur. This is something to keep in mind during wet years on very silty or sandy bottom ground, or on flat hill ground with low organic matter.
High pH can reduce plant availability of Boron, especially when pH exceeds 7.0. Temporary tie-up of B is known to exist following liming on very low pH soils (liming soils under 5.0 pH). A Boron treatment after liming may be a good precautionary treatment in case the surface pH is over-neutralized or low pH soils have been treated.
How much Boron should be applied to keep plants healthy? Not much! Some areas in Michigan and Minnesota that are more susceptible to Boron deficiencies in corn and beans only recommend applying 1 lb (this would be a about 5 lb of Solubor or 9 lb of Borax) of dry B every 3 years. Rates as low as 2 lb./ac have been known to cause Boron toxicity.
If you are planning to blend Boron with potash or 11-52-0, you need to be confident the blend distribution is even, there is no settling and separation of products in transport, and that spread rate is even. An over application on a field that has low water infiltration may take years to leach and metabolize toxic Boron levels.
Foliar application of Boron is by far the safest bet. The treatment is directly effective to plants in-season, maintaining the suspension and application rate is more reliable than dry application.
Boron is an essential nutrient that healthy corn and soybeans require. But because of the interaction with pH, Organic Matter, and other nutrients it is higher up on the fertility ladder than other inputs. Starting with pH, Phosphorus, Potassium, Sulfur, and Zinc. By working on the lower rungs of soil fertility first, we can be more secure in having Boron when we have adequate crop moisture. Once you are squared away on other nutrients, foliar Boron is a good place to start for checking crop response to the input.
Light Rate Lime - Effective - Reduces Risk
2022-12-20
For a few years, we’ve been encouraging lower rates of lime in no-till fields. You can scroll below to our post from 12/16/2021 for more details. The basis behind low rates is that surface applied lime only neutralizes to a depth of 1-3” if it is not tilled.
We’re often asked why not just till it in then?
- You likely aren’t going to till deep enough to hit the strongest acid layers (4-6” deep) on a single year of tillage.
- Moisture is the most limiting factor on yields in our area. The loss of residue, soil structure, and organic matter from tillage will have a significantly greater adverse impact on yield than deeper neutralization will.
The lower lime rates appear to be more persistent than we originally anticipated. We checked pH on a couple farms that had low rate VR prescriptions applied 4-6 years ago. To our surprise the top 2-3” has remained in a good pH range (6.0 – 6.8) for a majority of the field. These spot checks are a limited sample size, but good news none-the-less. Additionally, we checked fields that were applied with some heavier rates (2 ton average) 3-4 years ago and found a hard stratification line at 2-3” depth. The hard stratification was an abrupt line of pH in the surface at or above 6.4 that instantly hit a pH below 5.5 at the 3” mark.
For half the product cost it appears we are getting similar neutralization effect.
In checking some fields that had 2 tons of lime flat rate applied last Fall, we made some disturbing observations. Areas in the fields that had higher residue levels or some topographic relief, had visible lime fragments on the surface; other exposed areas in the field appear to have lost all applied lime when the December 2021 storms rolled through. pH is all over the place in those fields now. There are areas with lime that are near neutral and other areas that had 2 tons applied with pH under 5.0!
Lower lime application rates:
- Allow growers to cover more acres efficiently with lime
- Reduce input costs or allow growers to redirect costs to other fertilizer deficiencies
- Reduce risk of lime loss from wind and water erosion events
- Allow growers to apply science-based decisions
Fungicide on Soybeans
2022-08-27
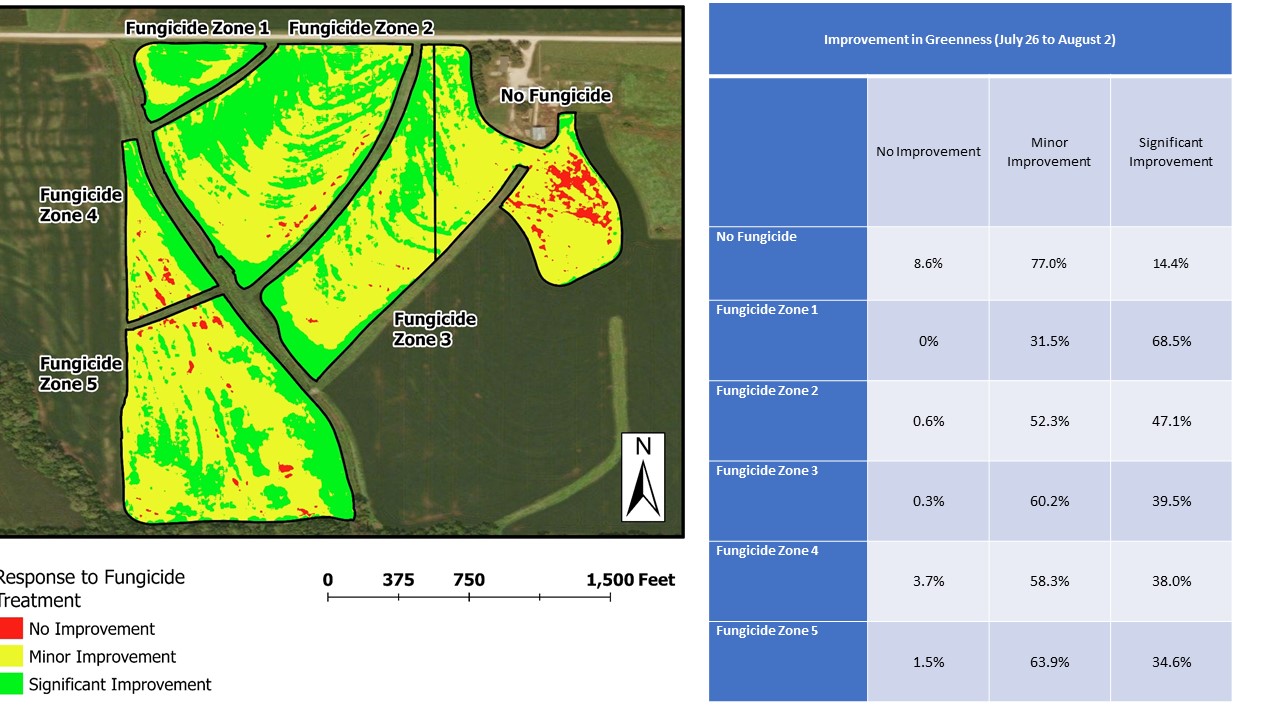
Similar to the response we showed in July to top dressing corn, we had a good response to fungicide on soybeans. We ran a drone flight on July 26th, a few days after fungicide application, and again on August 2. Regular color image showed some difference in leaf greenness. To make this difference pop out we converted the image to a VARI and categorized the difference in “greenness” across the field after splitting the field in to zones.
July Rain Totals
2022-08-01
July rain totals are very dismal. Southwest part of Otoe County inched above the Northeast. However, the Burr area missed out on the last showers that came through last week. We’ll provide some data soon on soil moisture and evapotranspiration rates.
Always Greener on the Other Side
2022-07-21
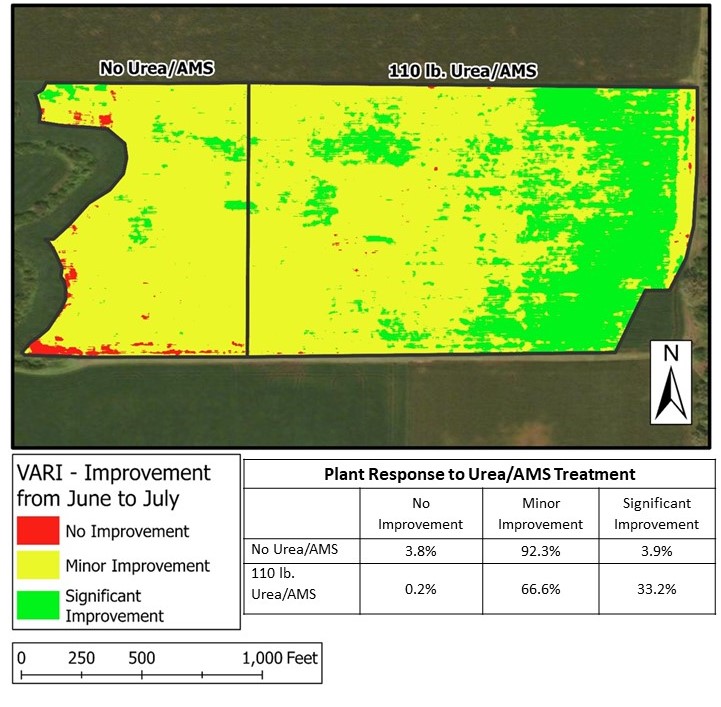
With the cost of fertilizer, chemical, and applicator rates, it is nice to know when a treatment works. And it’s even better when you don’t have to wait for yield data. We had a good opportunity to demonstrate the effectiveness of top dress fertilizer this summer.
- June 23 we applied a top dress of about 110# of Urea/AMS to the east side of the field above.
- On June 30 we collected drone imagery
- Fertilizer got rained in on July 6 with about 1” in 24 hours.
- We flew the field again on July 12 to get imagery of the crop response
We demonstrated, following top dress application, the field got “greener”. One of the benefits of doing the differential image analysis is: we can look at the response to a product and obscure the inherently low yielding areas. This field happens to be a good example; there is a wet spot in the middle of the field entirely in the top dress area that always has lower yields.
Waiting to evaluate this field with harvest data alone may not show positive results because of the historically low yielding area. For growers that have 5 or more years of harvest data, we could look at changes against the field average to look at the treatment response and ignore the low yielding area. But for growers with no yield data or those interested in seeing more immediate results we can use imagery analysis.
Japanese Beetle - GDD for Scouting
2022-06-28
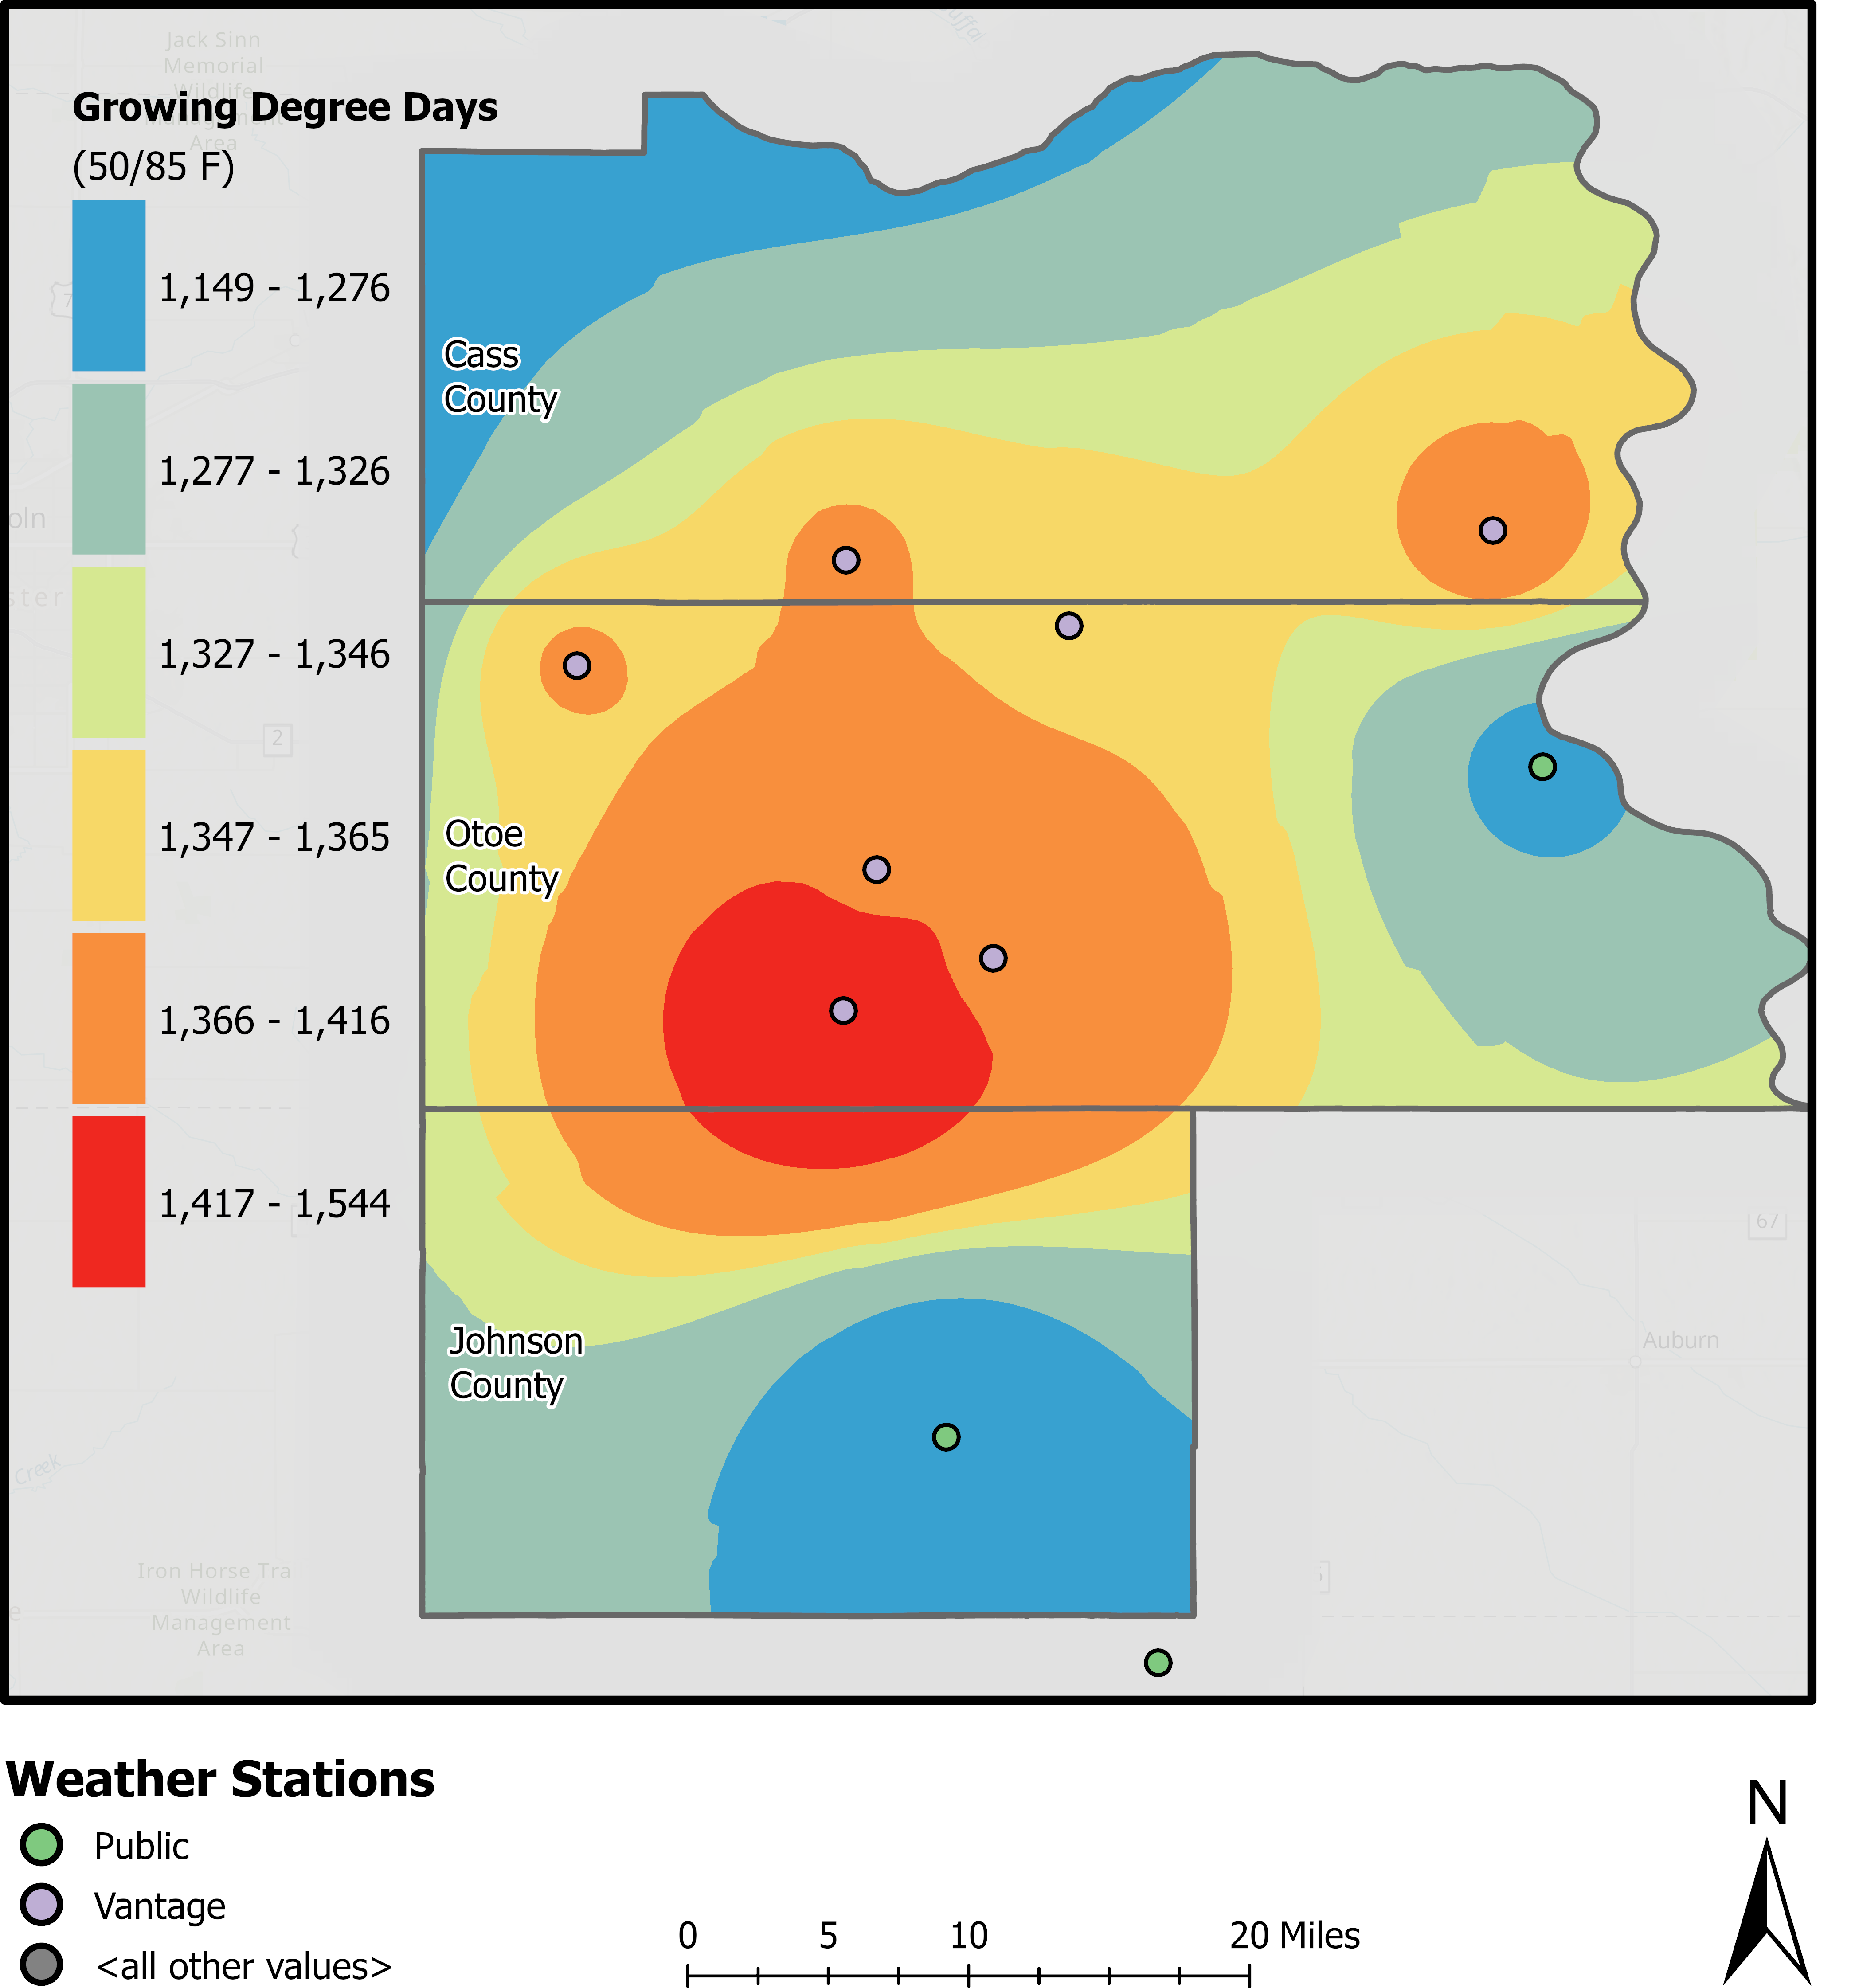
If you have grape vines or raspberry canes in your garden, you are well aware that Japanese beetles are back. We start seeing adult beetle emergence at just over 1,000 Growing Degree Days (GDD) since January 1 and they will continue to merge until more than 2000 GDD have accumulated. p>
The image above is a heat map of accumulated GDD as of June 27. For soybeans, fields should be checked just before flowering starts to determine if Japanese beetles are still present and causing enough damage to warrant treatment.
Japanese beetles don’t usually attack corn foliage. However, they can cause significant damage by feeding on tassels and silks. Be prepared to apply foliar insecticide if you catch infestations during early pollination.
May Rain
2022-06-04
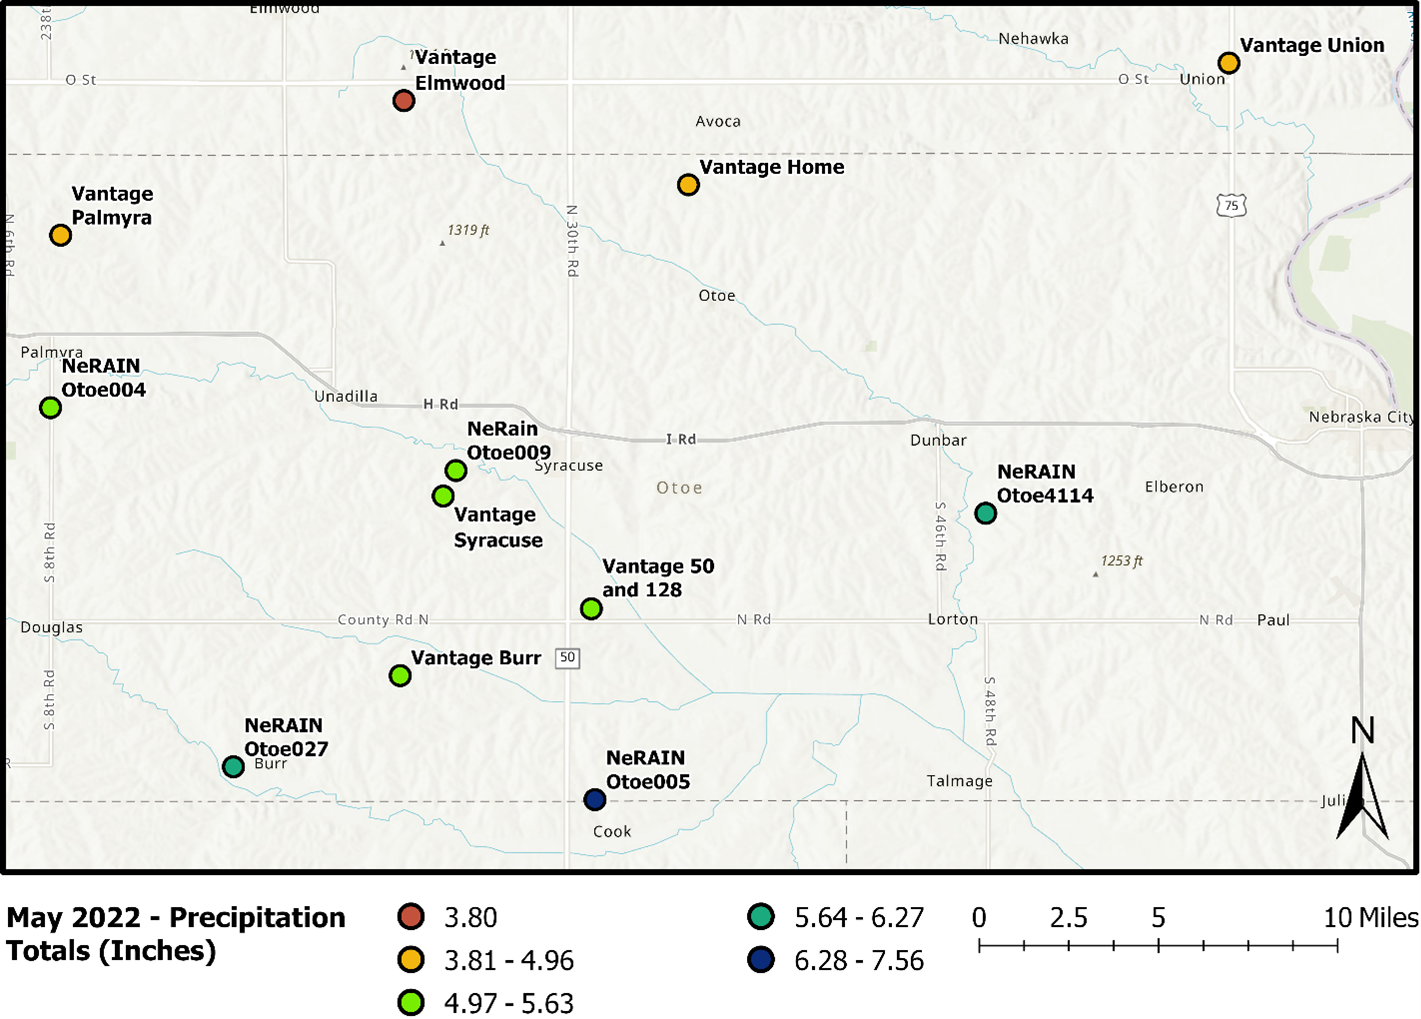
May rainfall totals show north Otoe County and Cass County is a little behind the south part of Otoe County. A majority of the rainfall came at the end of the month.
Late Season Frost
2022-05-24
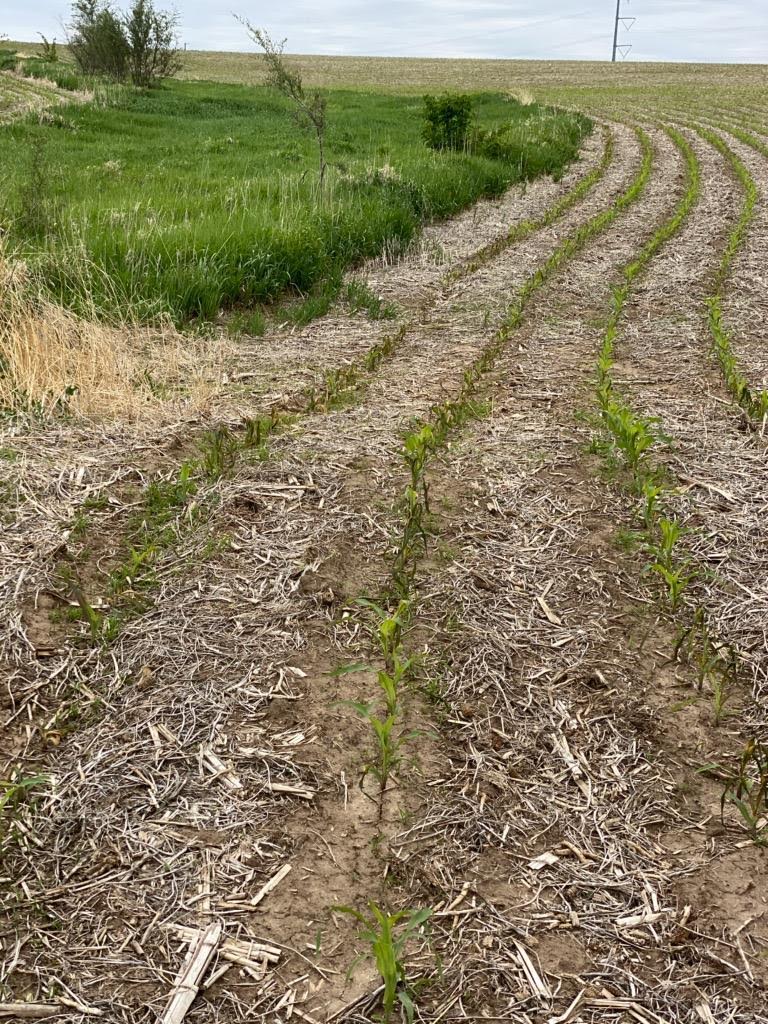
Some low lying areas in fields were hit with frost Sunday. The weather stations are located higher in the landscape and didn't detect a freeze. Damage observed so far is primarily near creeks and waterways with some damage interior of fields.
Eyes in the Sky
2022-05-05
This year Vantage Agri Service added a couple of drones to the toolbox for assisting growers. We got them up in the air for the first time earlier this week just to get familiar with the flight controls and the ability of the units.
Most folks are acquainted with the drones and using imagery to analyze vegetation indexes, stand counts, and crop damage. While we plan to use those tools to help interested growers once crops are up, we’re already seeing utility in units before emergence.
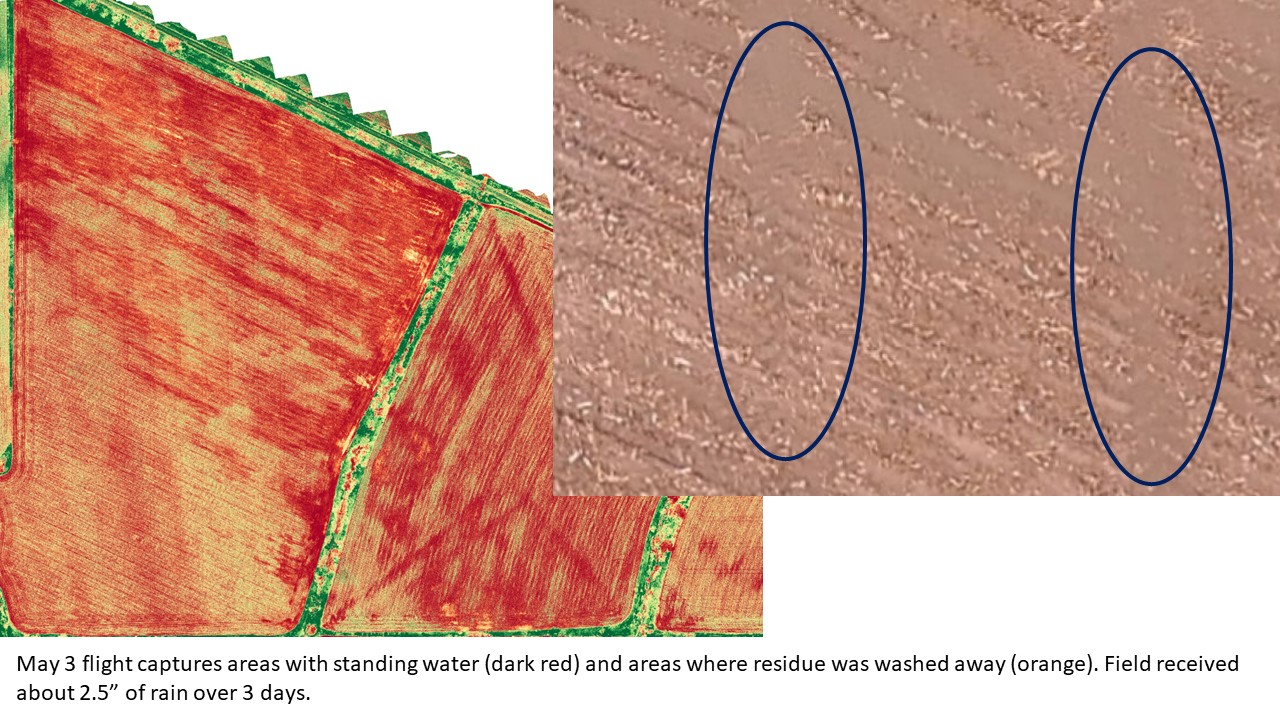
Following last weekend's storms, we flew some bottom ground to see if we could pick up the extent of flooding on fields. The drones we are using are equipped with a camera that is powerful enough to capture images smaller than 1” while flying 300’ above the field.
After pulling the photos into a map we found it difficult to distinguish between the shades of brown that were standing water or that were exposed bare soil. Using one of a couple software packages we have available, we assigned an index color to areas we knew were water. Fortunately due to the high camera resolution, we could see sprayer tire tracks and where the tread disappeared to confirm standing water (circled in the picture above). We can map out the areas of standing water (dark red), bare soil (red and orange), and crop residue (yellow).
Most growers already know these areas exist in your fields and just deal with them knowing they will be flooded out at some point in the year. Just accepting the loss is certainly one way to handle the problem. We hope to figure out some solutions to help growers recover these areas.
- We can assume leaching loss of Nitrogen and Potassium in areas with standing water
- Areas where water has accumulated will likely warm up slower (scroll down to see more on wet soils)
- Impacts on emergence and crop health can be tracked through the growing season
Tracking these events through the year may help growers piece together a story that shows how a field condition may have compounding impacts on their crop. Sometimes this might be the tool to demonstrate physical limitations than can’t be fixed with chemical, seed, or nutrients like tree removal or improved drainage.
Cold Soils
2022-05-01
With the calendar flipping to May, its easy for growers to think they are behind schedule if corn planting isn’t wrapped up. This is especially true when we had weeks of dry weather and what looked like a seasonal warming starting last week. Ignore the calendar and pay attention to the soil.
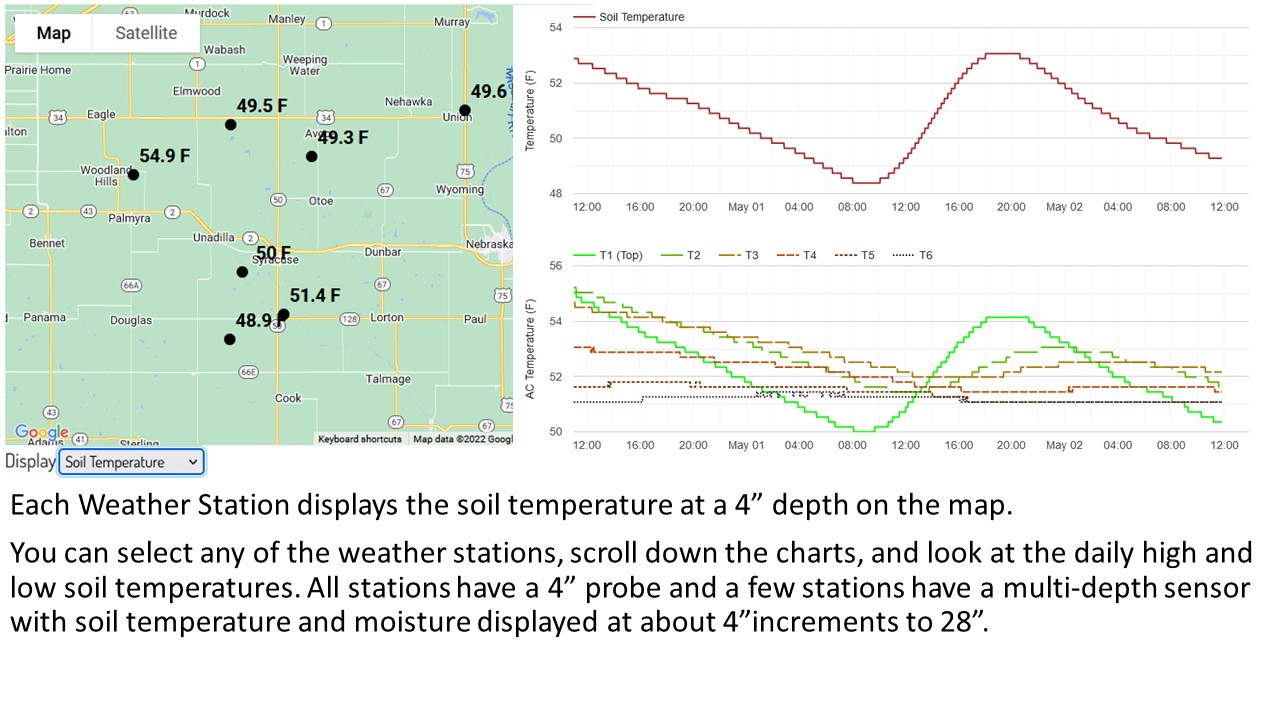
One of the cornerstone sensors we have on all weather stations is a soil temperature probe at a 4” depth. You can see all the soil temperatures displayed on our Map on the Network page. Or you can look at longer term trends by clicking on a specific weather station and scroll down to the soil temperature graph.
The magic number we are looking or in the Spring is 50 degrees. We want to see 50 degrees at 8:00 in the morning for multiple days and look at the 7-day forecast to ensure we will remain above the threshold.
Cold temperatures can result in injury to the germinating seed as it is absorbing moisture – a problem called imbibition injury. Damage to germinating seeds can occur when soil temperatures remain at or below 50 degrees after planting.
Soil temperatures at the 4-inch depth during the first 24-72 hours after planting are critical. It is during this window kernels imbibe water and begin germinating. Kernels naturally swell when hydrating – taking in water. If the cell tissues of the kernel are too cold, they become less elastic and may rupture during the swelling process, resulting in “leaky” cells. Injury symptoms may include swollen kernels that fail to germinate or aborted growth of the radicle and/or coleoptile after germination has begun. For us to see this type of damage, soil temperatures likely need to drop below 40 degrees.
Chilling injury can also occur following germination as the seedlings enter the emergence process. Chilling injury to seedlings can result in:
- Reduced plant metabolism and vigor, potentially causing stunting or death of the seminal roots
- Deformed elongation of the mesocotyl
- Delayed or complete failure of emergence, often leafing out underground
Before making any decisions, fields should be scouted 4-7 days after the cold occurred as the extent of the damage and potential for new growth will be evident during this time.
Get a jump start on planting before we are totally in the clear on soil temperature with the use of fungicidal seed treatments, in-furrow fungicide, and in-furrow insecticide. Low rates of in-furrow starter fertilizer or higher rates of 2x2 starter are very beneficial on cold soils as well. The use of biologicals should theoretically get you a “warming” effect as well.
Split Nitrogen Trial Part 5
2022-03-26
If you take some time to scroll to the bottom of this page, you will see in 2021 we set up split rate and top dress nitrogen trials with about 8 different growers. You can read about some of our early results from soil and tissue testing there.
Who cares about the soil and tissue tests? What really matters is yield performance. As it goes with the best laid plans, we ended harvest with yield monitor trouble on about a third of the fields we monitored. For the remaining fields we looked first at breaking out yield results from the 2021 data in each trial area. The results of just looking at 2021 yield data showed us…..next to nothing.
We realized that either all the university researchers, extension agents, and agronomists recommending top dress N were either wrong or that we were looking at the data incorrectly. Fortunately for one field we had about 3 years of corn yield data to compare the 2021 results to.
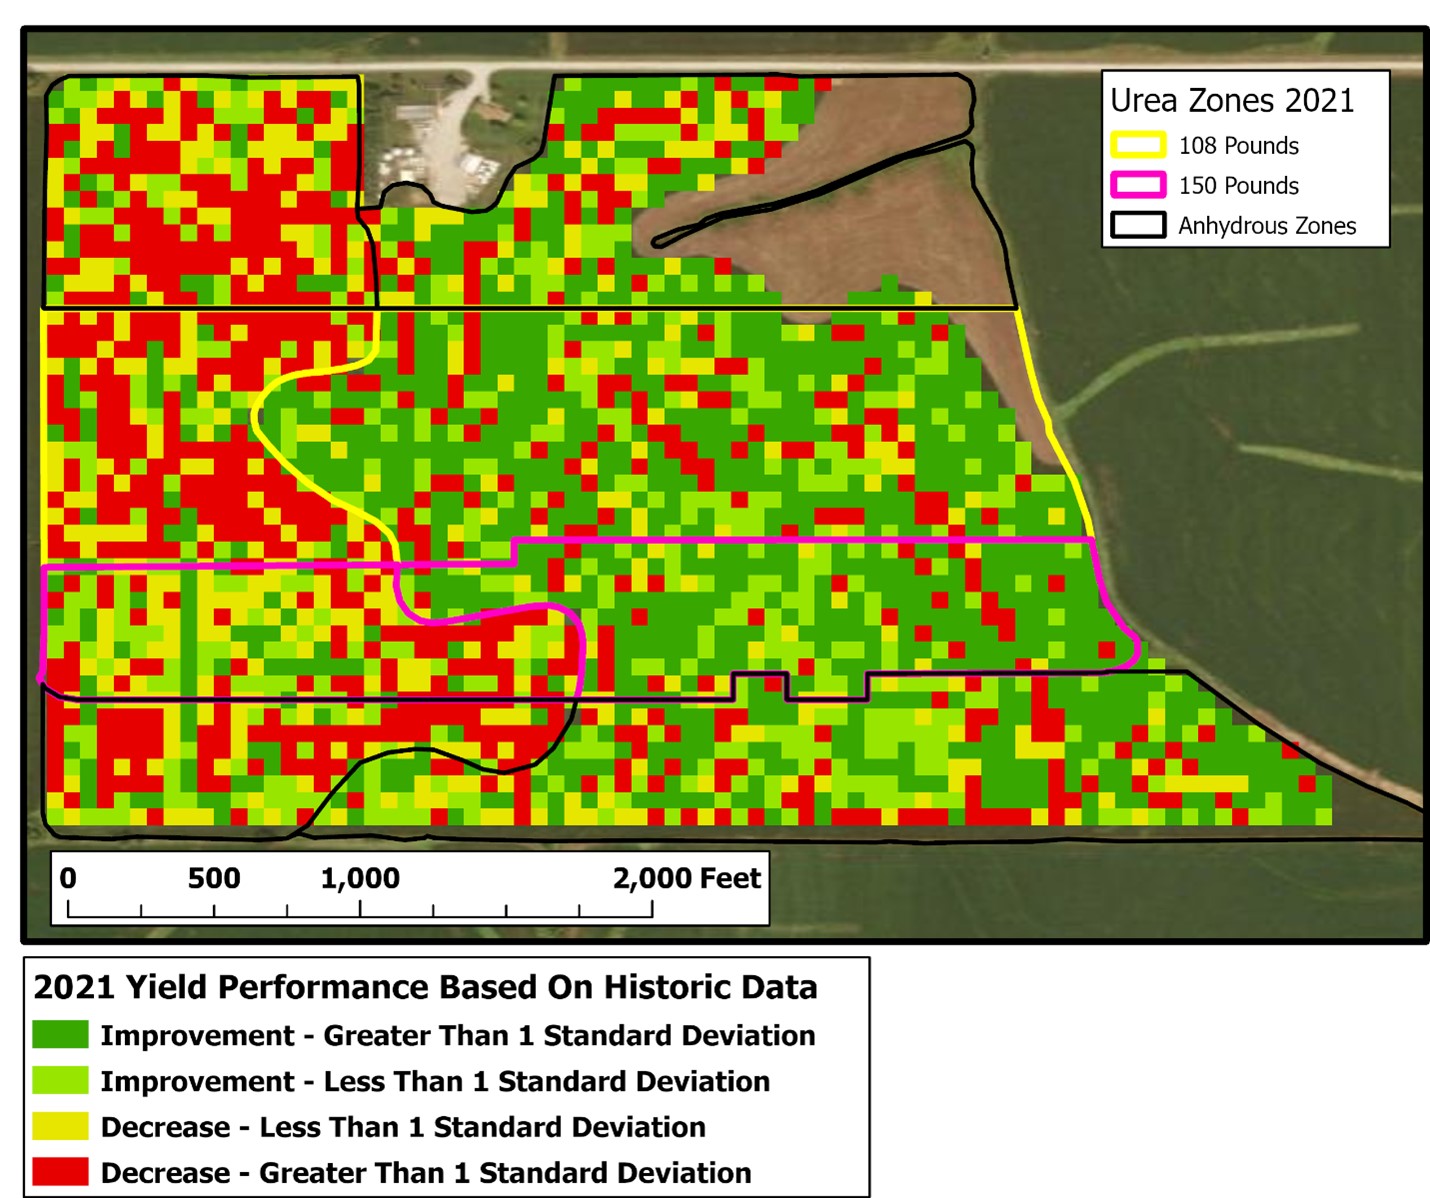
The field in question was a fairly complex trial. The west half was in a single year corn/corn rotation. The middle of the field was planned for 60/40 split of Fall anhydrous with top dress Urea. When the Urea was applied, a few strips of a heavier rate were applied to just empty the spreader bin. The North and South strips in the field received 100% Fall anhydrous.
We created a grid giving each cell an average yield value for all years. The map above shows the areas in green that beat the average for the field in 2021. In our corn/bean rotation area, the portion of the field that was split applied with 108# of urea had about 10-15% more area outperform the average than areas that only received Fall anhydrous. Where 150# urea was applied, more than 20% of the area outperformed the Fall anhydrous applications.
We can certainly see a benefit to split rate application for some growers depending on their customary application rate. For growers applying lower anhydrous rates, the same results demonstrate benefits of a planned top dress.
More importantly, this trial demonstrates the usefulness of yield data and sound data processing. When you try a new seed rate, hybrid, or fertilizer rate you want to see the yield map pop that trial out in bright green on the yield map. The fact is, our cropland terrain is often too complex and masks the results. Fortunately the tools to break that data apart are getting better. If you have monitors in the cab, be sure to get your data preserved, you may not have a use for it now, but there will be a time when it will go to work for you.
Cold Weather Helps Compaction
2022-01-22

The cold weather is bringing one benefit that we’ve missed out on for a few years – deep freeze thaw. Cycles of freezing and thawing in the soil help remove compaction. A majority of the compaction we see from wheel traffic in fields is at a depth of about 3-6”.
We have soil temperature probes at a depth of 4” that allow us to monitor how many cycles of freeze thaw occur in a year. The past few years have only recorded 1 or 2 cycles of freezing because severe cold has been coupled with thick snow that insulates the soil. Our weather stations are primarily located in fence lines and near grass, so many of the soil temperatures read higher than what represents the actual field. The Union and Burr stations are the most accurate for representing field conditions.
Based on the soil samples we’ve pulled the past couple weeks, frost depth has been as deep as 6” on hill ground and over 8” on bottom ground.
This year we’ve literally had the perfect storms. Light snows, followed by a melting warm up, followed by severe cold. These cycles freeze and expand moisture in compacted pores resulting in a “fluffed” soil.
If you have a field with good fertility but has declined yields over the past 3-5 years, compaction could be the issue. Hopefully this year’s freeze/thaw gets the field back on track. A couple years treatments with cover crops could also provide a significant benefit to recover compaction as well.
How to Figure Out Lime Rates
2021-12-16
Is there any value in pulling soil samples to determine lime requirements for a field? Or should you just spread 2 tons every 7 to 10 years? Putting on a couple tons was probably a good practice in the 70’s through the 90’s. As much as I long for the simplicity of the 90’s, we need to adapt to the science and technology of this century.
Most nutrients applied to fields result in acidificaiton of soils. Anhydrous has about half of the acidity of 11-52-0, but because it is injected, it can cause acid stratification at the depth of injection. Even though 11-52-0 is a stronger acid, we rarely apply high enough rates compared to anhydrous to equalize the acidity in the surfce to the injection band.
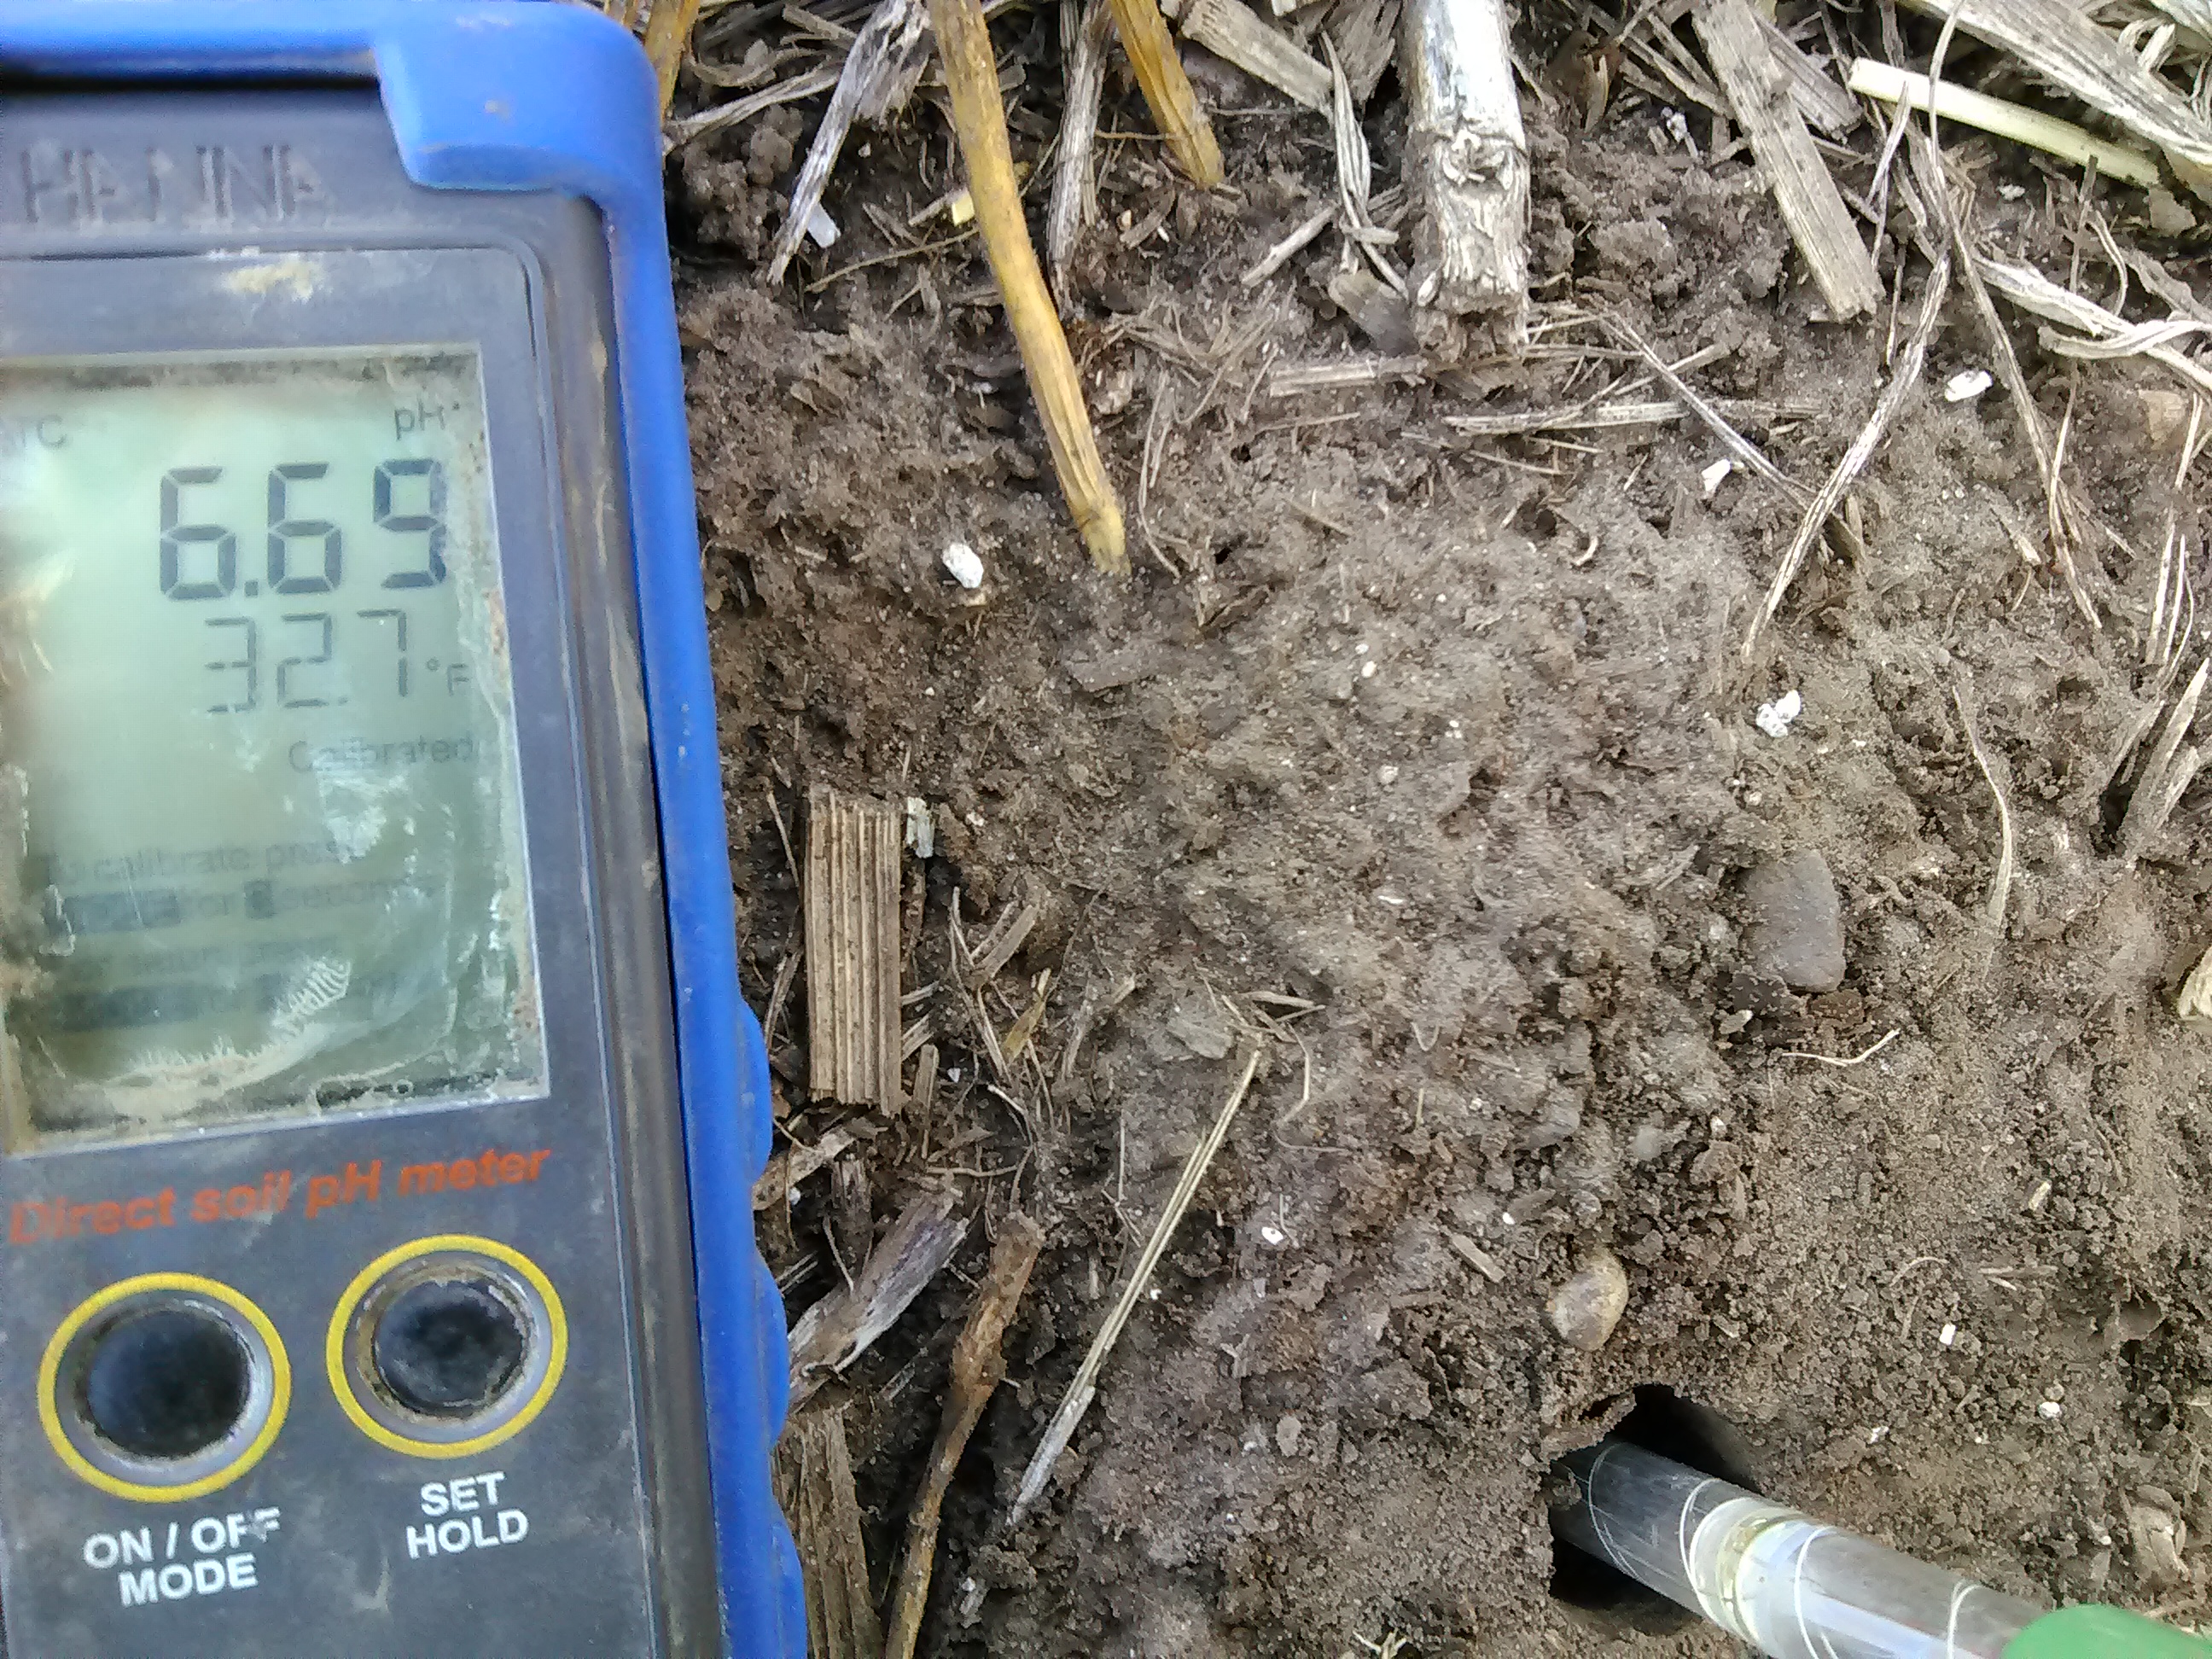
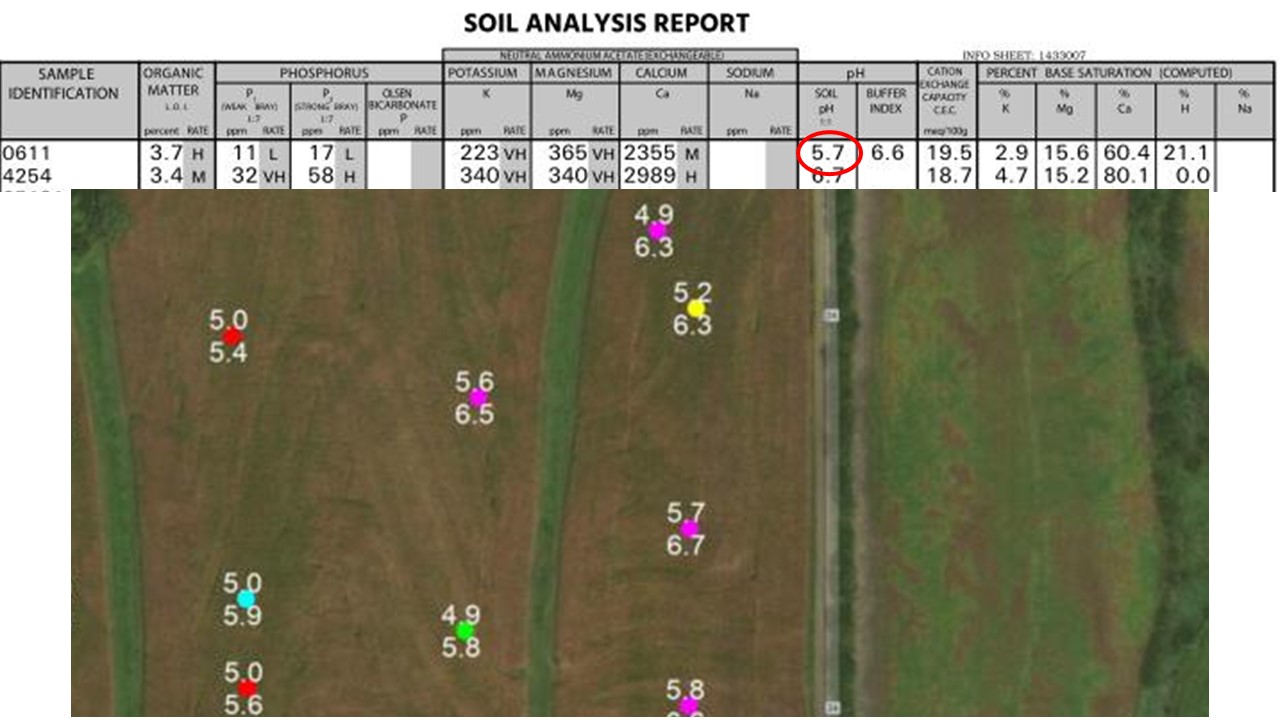
The photo above shows a farm we sampled a couple different ways recently. The map points display pH measurements we took in the field with our field pH meter (pHilis) at depth of 2” (bottom #) and 6”(top #). The lab results were a taken from the same locations with 6” cores representing about a 2.5 acre grid. As you can see about half the area has a surface pH (2”) that doesn’t require lime, but the west side calls for lime. Additionally, there is pretty strong stratification.
If we relied exclusively on the grid soil test (5.7 pH), we would not have captured the areas where lime in not required on the east. In addition, you can see some of the samples had a significantly higher number in the surface than the subsurface – this is only 4” above but is combined in the same grid sample. Results from grid sample cores wash out the detail of actual values in a grid or zone and combine an average value of the core.
Studies over the past couple decades clearly indicate that acid stratification occurs in no-till fields. No till fields also result in a limited depth of neutralization after liming. Liming no-till fields typically only neutralizes soil to a depth of 1-3”.
When we were regularly plowing and disking fields, the top 6-8” of soil were mixed.This made grid, zone, and composit soil samples more accurate because there was typically no error from stratificaiton. The old lime rate of 2 tons was more accurate then because growers were mixing that rate into the 6” profile.
Applying lime rates intended for neutralizing 6” of soil run the risk of over nuetralizing the surface. We want to avoid pushing the top 1-3” into a 8.0-9.0 pH situation. If we bump the soils into a higher pH, we risk impacting the availablity of P, Zn, Boron, and Copper – most of these nutrients are typically highest in concentration in the surface.
Using grid and zone soil sample results for lime recommendations is a good tool as long as you understand the limitations: 1) you might not catch high and low spots in your sample area, 2) your overall pH value is likely lower than the value you can change with lime if you are no-till.
For growers that do a good of managing fertility, regular P, K, and Zn application at a removal rate or better, grid or zone sampling may not b extremely beneficial to you. However, quality pH measurements should still occur on a regular basis.
For growers who have recently picked up a neglected field, obtaining pH data is great starting point to address lime needs before tearing into nutrients with grid or zone sampling.
Tips and tricks:
- Periodically surface apply nitrogen instead of anhydrous injection; this will help reduce acid stratification
- Apply some cover crops; let turnips and radishes do some tillage for you to mix the acid stratification
- Lime more frequently at lower rates; apply lime to neutralize 2” or 3” of soil instead of 6” and check pH every 5-7 years
Fall Army Worm
2021-09-18
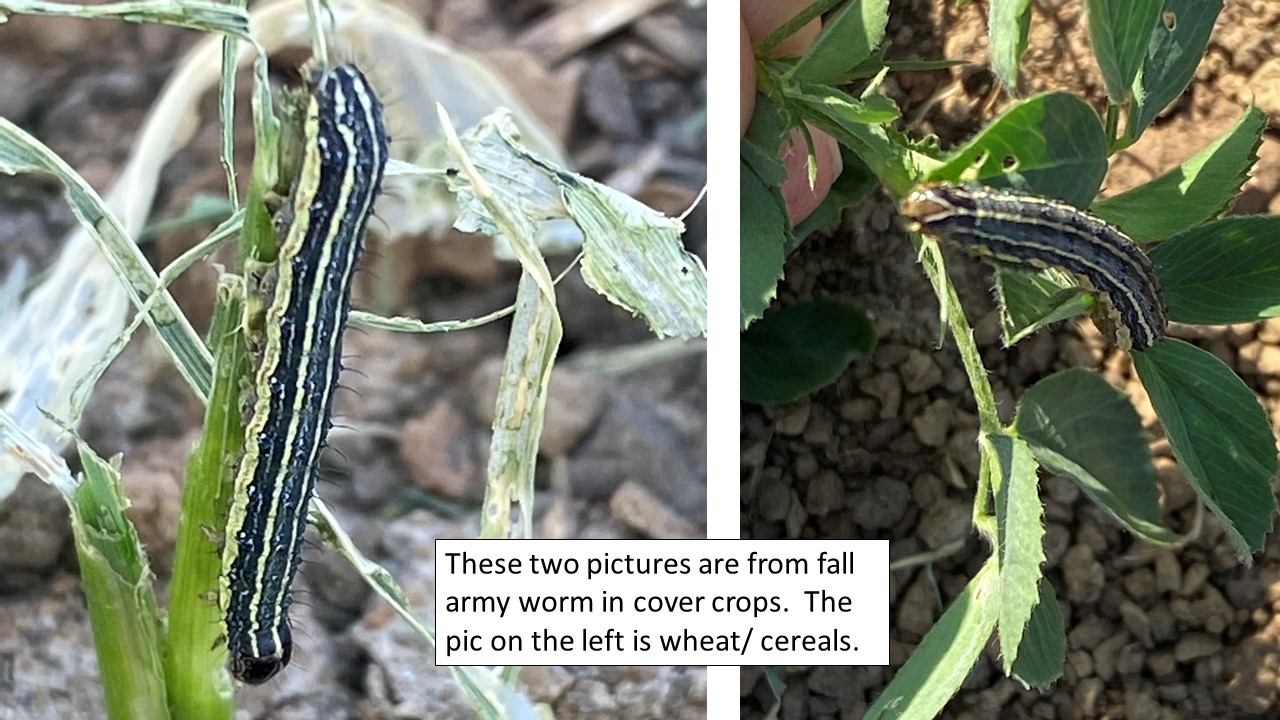
Reports are increasing with infestations of fall army worm in alfalfa, newly seeded cover crops, and grass lands including pastures on the south range of our trade area. We sprayed a field of alfalfa on Thursday.
We would advise scouting of these areas. Significant damage /feeding will occur in the later instar stages if not watching fields where they are present. Feeding will decrease with the forecast of cooler temps.
It's not a Weed if it was Planted
2021-08-17
Many of you can recall the years it used to take a farm after terraces were built to recover. Compaction from heavy equipment, stripping organic matter from the cut slopes, and redistributing fertility used to be evident for decades. Farms being under continuous no-till are likely a contributing factor quicker recovery.
Now it seems like corn yields recover after a few years and the yield declines aren’t near as drastic. Improved, drought-tolerant genetics and better hybrid selection to accommodate clayey soils and our moisture regime play a big role in masking the impacts of compaction and nutrient loss from new terraces.
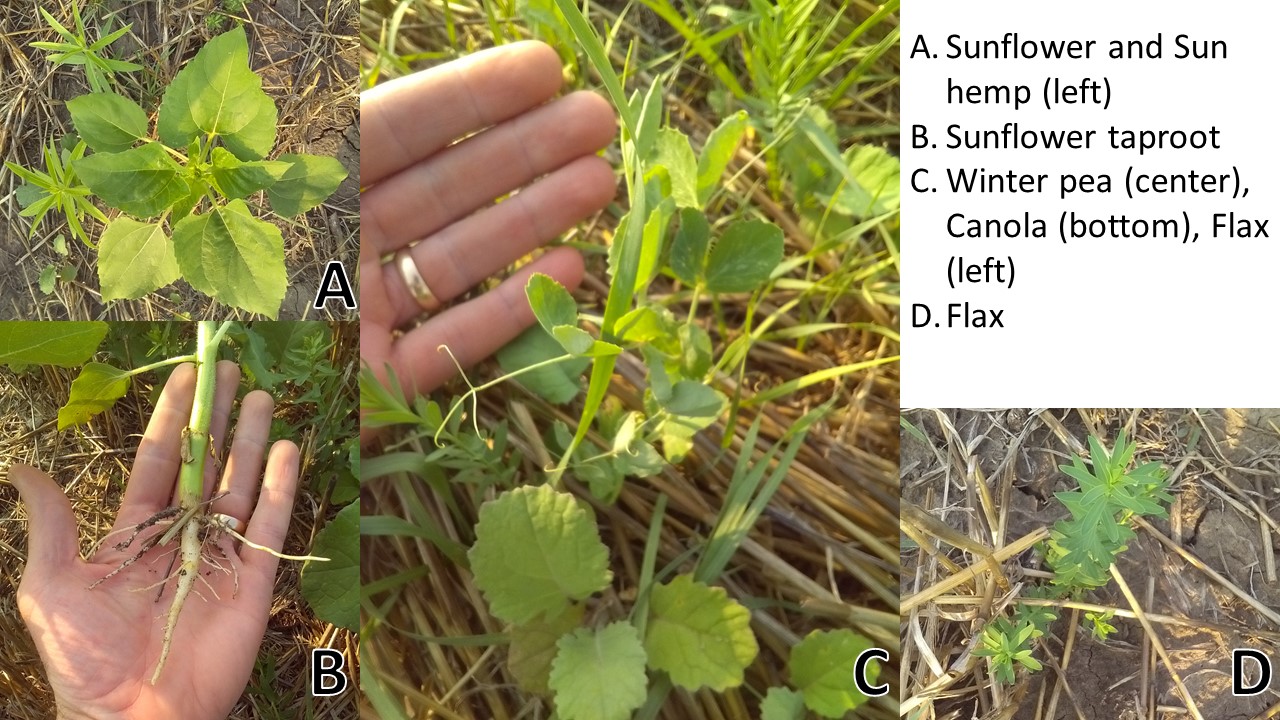
Impacts to soybeans appear to hang on longer in some fields. Bringing wheat back into the crop rotation gives growers an opportunity to work on compaction and build organic matter to help with field recovery. Planting wheat gives growers an opportunity to use some compaction fighting cover crops you just can’t make work following corn or soybeans. You may have seen some of these cover crops out and mistaken them for weeds; here is a quick rundown of some of the cover crops we’ve recently recommended:
- Sunflower: aggressive taproot to cut through compaction during drought; lots of carbon in the residue
- Sun hemp: drought tolerant legume with good taproot; nitrogen fixing; good at building organic matter
- Canola (rape seed): does everything radishes and turnips do; scavenge nitrogen and breaks up compaction; tend to live longer through the winter; lower cost
- Flax: good for organic matter; great for soil biology
- Winter peas: nitrogen fixing legume that works through the winter
Most cover crops will provide a benefit to reduce compaction and build organic matter. Opening up your crop rotation to fix a compacted field can really accelerate your recovery timeline. If you have a tight or compacted field, breaking up the rotation and treating with some specialized cover crops might be your answer. Get a hold of us if you need to figure out solutions within your normal rotation or more aggressive treatments.
July 31 overnight storm
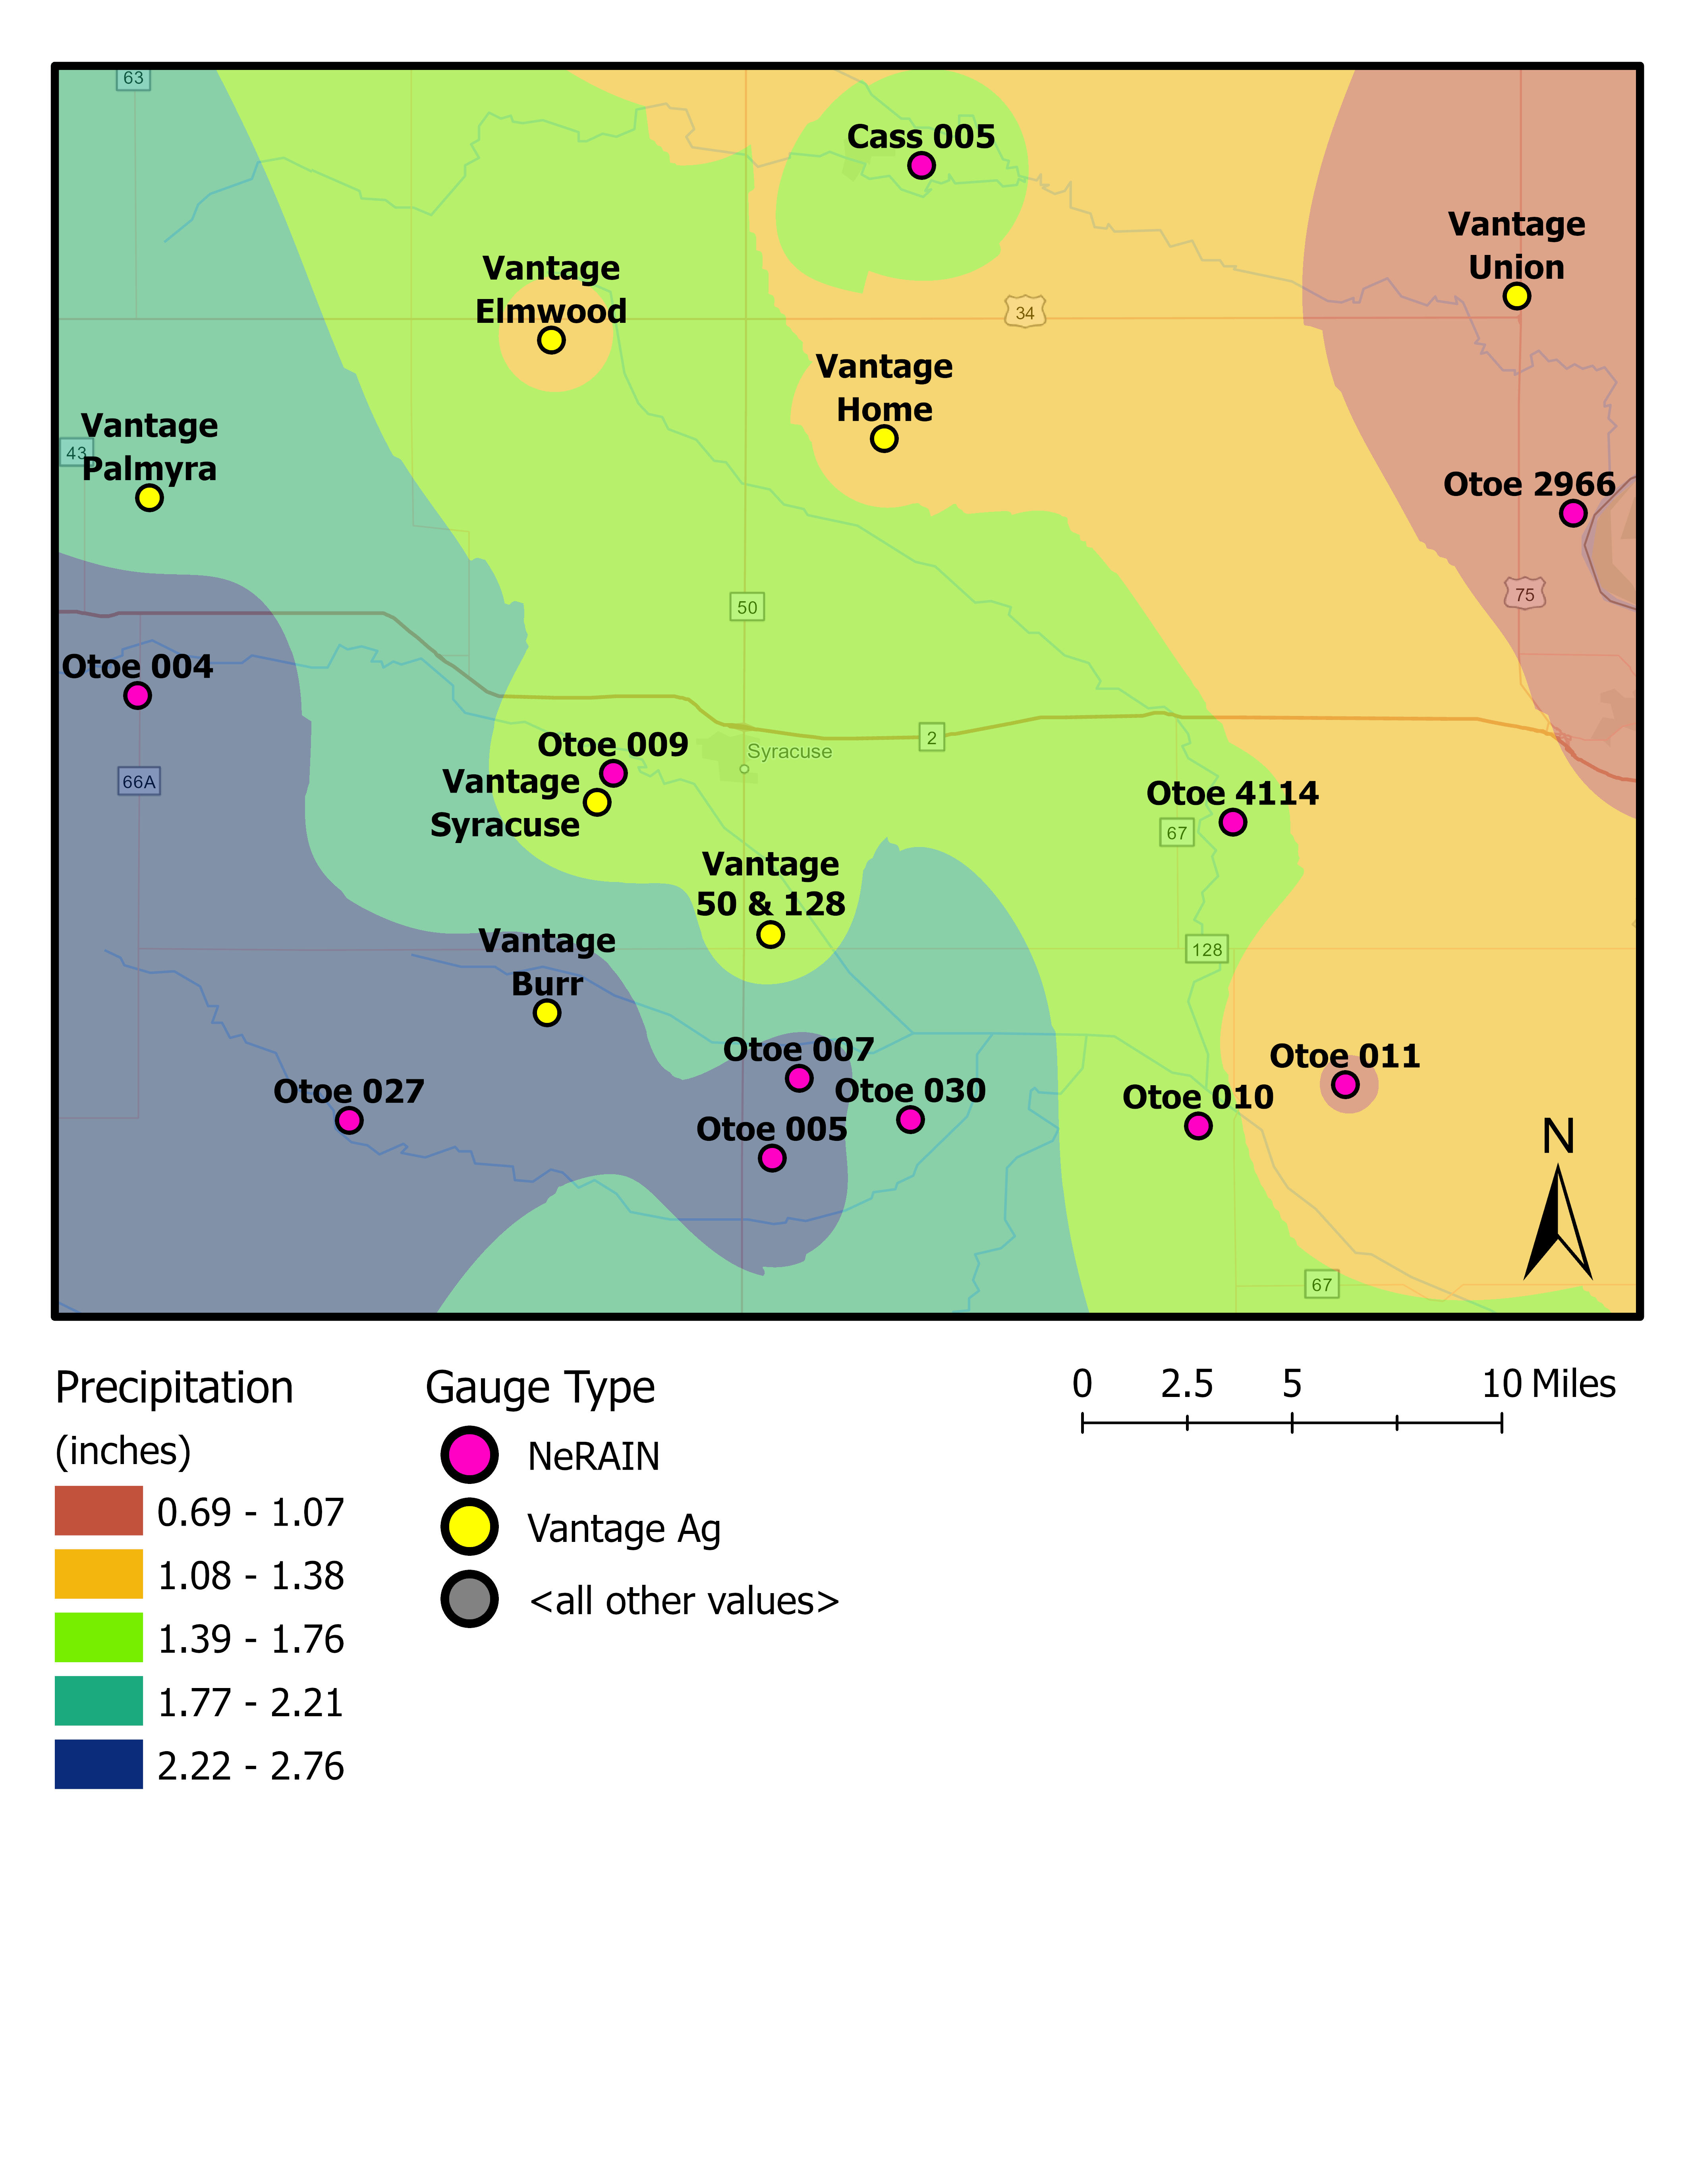
2021-07-31
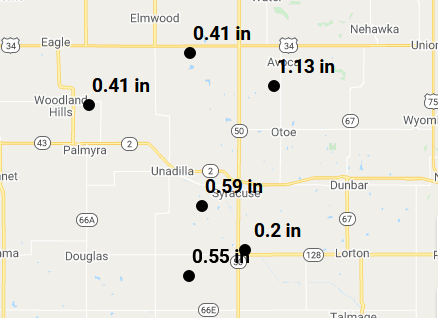
Its not unusual for us to see some spatial differences when it comes to summer rain events. Last night’s (July 31) overnight rain demonstrates how variable these storms can be.
Split Nitrogen Trial Part 4
2021-07-31
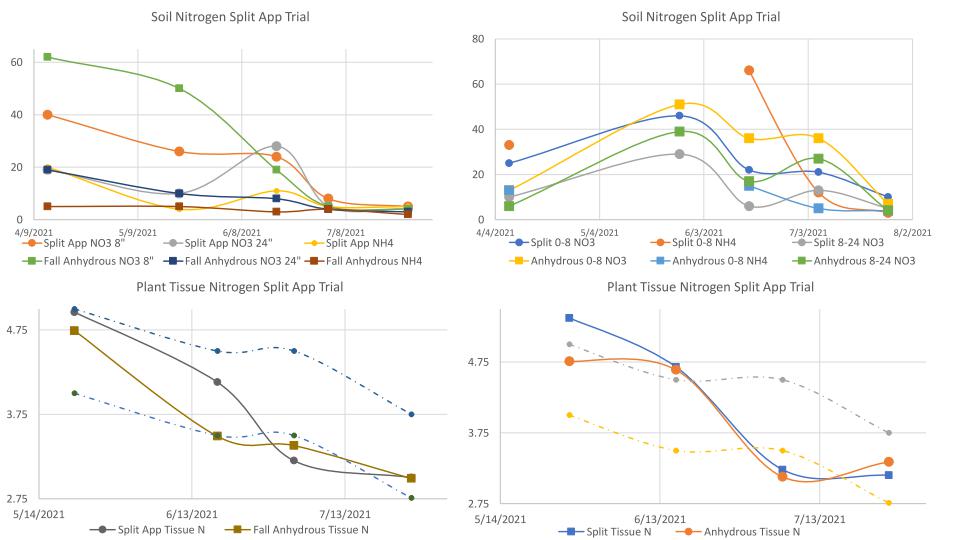
Our Nitrogen Trials have started to produce some interesting data. The charts above are from 2 similar trial sites about 2 miles apart planted in early April. Each site has 2 plots, a straight fall anhydrous run and a split application.
- The plots on left:
- Both had Fall application of 40 Rock (29# of actual N)
- 170# of actual N was Fall applied to the straight anhydrous plot
- 120# of actual N was Fall applied to the split rate plot
- We spun Urea on June 10th for an additional 53# of actual N on the split rate plot
- The plots on the right:
- Both had Fall application of 11-52-0 (14# of actual N)
- 180# of actual N was Fall applied to the straight anhydrous plot
- 80# of actual N was Fall applied to the split rate plot
- We spun a Urea/AMS blend on June 10th for an additional 98# of actual N on the split rate plot
Regardless of the starting point of soil nitrate levels before planting, plant tissue concentrations have remained about the same. This coincides with the data we’ve been pulling for the past 5 years or so – we’ve only seen low plant tissue N concentrations on either fields with compaction or fields with drainage issues.
Oddly enough, the straight anhydrous plot from the charts on the right had significantly high soil nitrate levels than the split rate plot when sampled right after spinning on product. There appears to be a strong correlation between precipitation, soil moisture, and organic matter that might explain the additional nitrates.
Rain Report July 8-14
2021-07-14
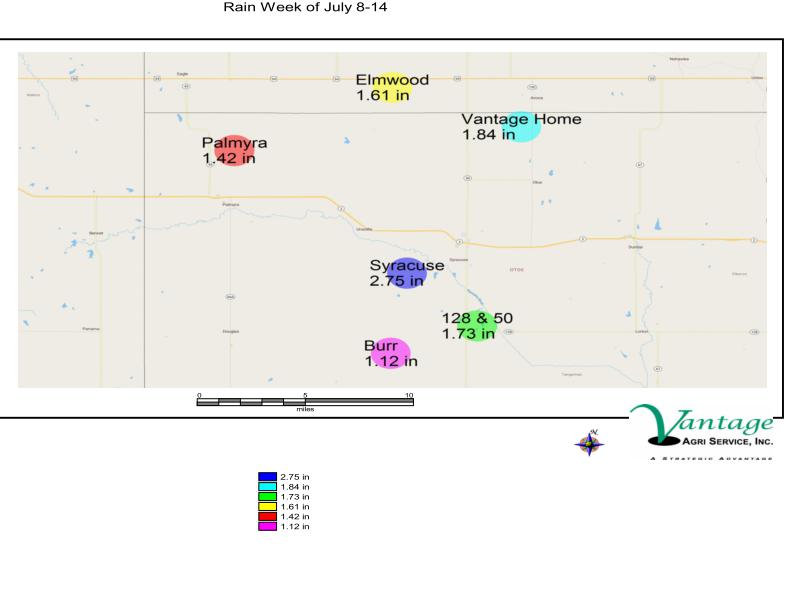
Here is a summary of rain totals from the last week, most of which came on July 10th.
Why Don't Wind Gusts Show Up All the Time?
2021-07-14
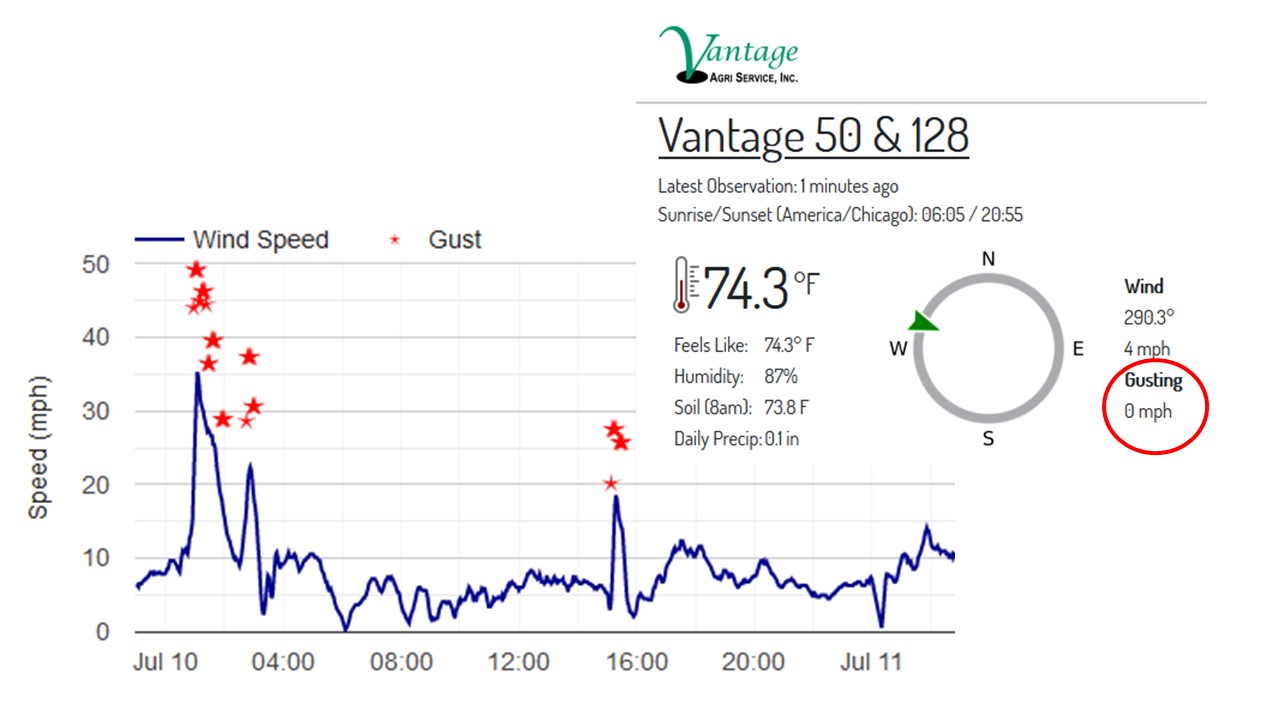
You may have noticed the dashboard (upper left box with temperature and wind for each weather station) doesn't always show a Gust even on windy days. There are likely a few reasons our stations are not showing gusts as frequently as airport weather stations: 1) Airports don't really define how they categorize a gust. Our weather stations are continuously reading wind and "looking" for an increase in wind speed of 9 knots (about 10 mph) over the 2-minute average. 2) We are measuring wind at a height of about 15-18' while airports typically are measuring at 30'. Our stations are giving a truer read of what is occurring on the ground or above the crop canopy, this means topography and obstructions impact wind speed more than the airport stations. 3) During the spraying season, we have the stations set to send a report every few minutes; if a gust was not measured between reports it will not show up on the dashboard again. A better location to observe wind gusts is by scrolling down to the wind speed graph for the day. By checking this graph regularly, you can anticipate when winds will get "gusty" or when they will calm down. While our stations may report wind speed and gusts a little differently than you may be used to seeing on Weather Service sites or with on-board systems, they are extremely accurate and resourceful for managing drift concerns.
Split Nitrogen Trial Part 2
2021-07-09
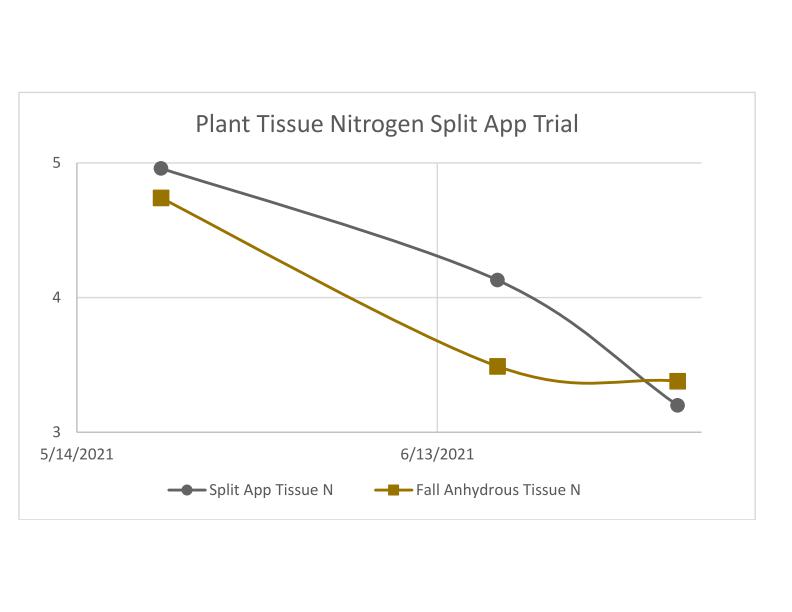
In addition to tracking soil Nitrogen levels, we’re keeping an eye on Plant Tissue Nitrogen levels. This site, along with the others we’re monitoring this year, had very good Nitrogen numbers in early growth stages. The early tissue numbers were good regardless of Nitrogen rates or fertilizer forms. The full rate anhydrous plot dropped off in N content in the plant sooner than the Urea plot. This is an early indication that corn in this field effectively used the top dress Nitrogen. Although N concentrations have reduced, the N content is in a healthy range.
Split Nitrogen Trial Part 1 UPDATE
2021-07-09
We just received lab results from soil samples earlier this week. This is same set of plots mentioned 7/7/21. With the good heat, sun, and precipitation the weeks following the Urea top dress, it looks like the plants have mined a significant portion of the available N in the soil. Between the soils and tissue tests it looks like the nutrient profile is evening out between treatments in this field. Hopefully we see a difference on the yield monitor.
Split Nitrogen Trial Part 3
2021-07-09
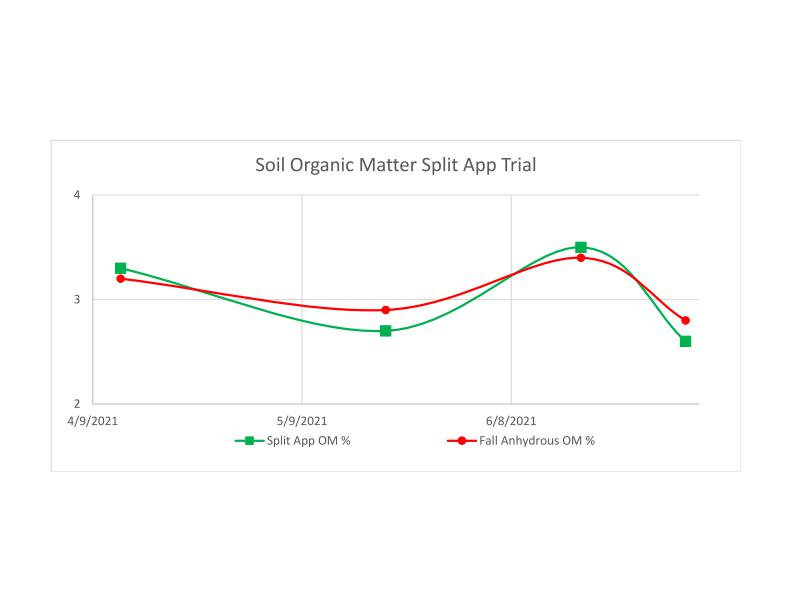
One of the additional elements of the Nitrogen study we’re following is Organic Matter (OM). We know OM releases Nitrogen throughout the growing season. At the end of the growing season we’ll match up our samples with precipitation, soil temperature, and soil moisture data to track release conditions. Our early theory is: when Soil Nitrogen levels are low and there is adequate soil moisture, OM will decrease from microbial activity. So far it looks like our theory is holding true – when soil N levels dropped in July, OM content also reduced but plant N concentrations are sustained at a sufficiency level.
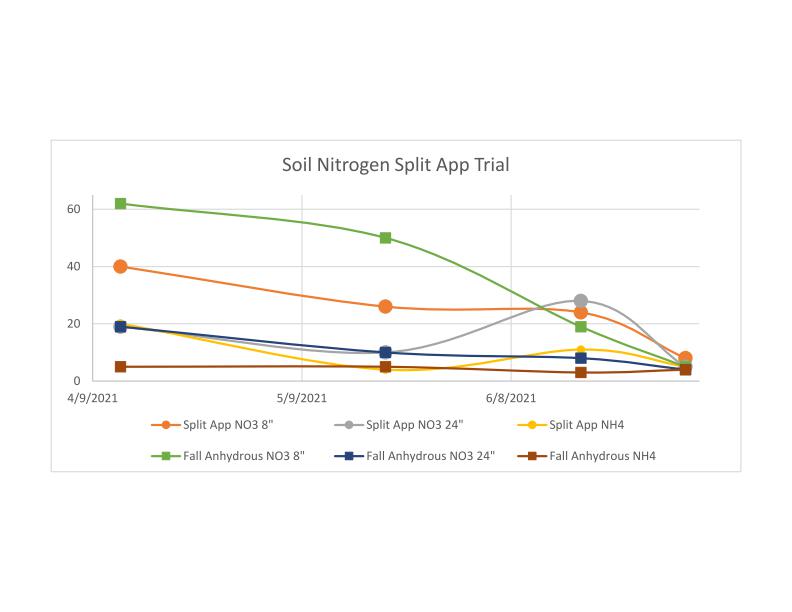
Split Nitrogen Trial Part 1
2021-07-07
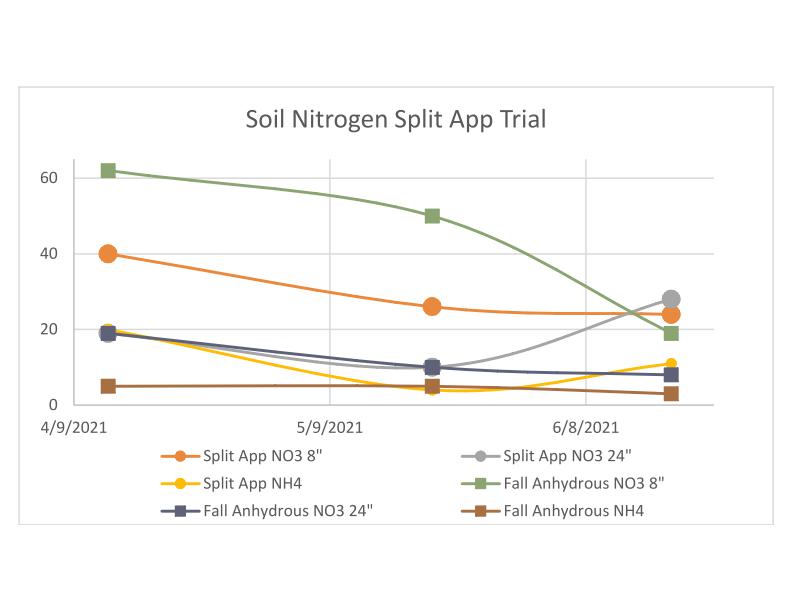
This summer we're tracking nitrogen use on a variety of different treatments (you can read more about those treatments on our June 15 post). The graph above shows Nitrate levels in the top 8", 8-24" as well as Ammonia Nitrogen in the top 8". We have side-by-side plots of a full-rate Anhydrous applied last December with a half rate Anhydrous plot. Preplant and early in the growing season Nitrogen levels were significantly higher in the full rate plot. A top dress was applied on the half-rate plot on June 11th prior to a 0.6" shower. Nitrate levels increased following the rain for the split-rate plot and decreased in the top 8" for the full-rate plot. We will continue to track nitrate levels through the growing season.
They're Back
2021-07-05
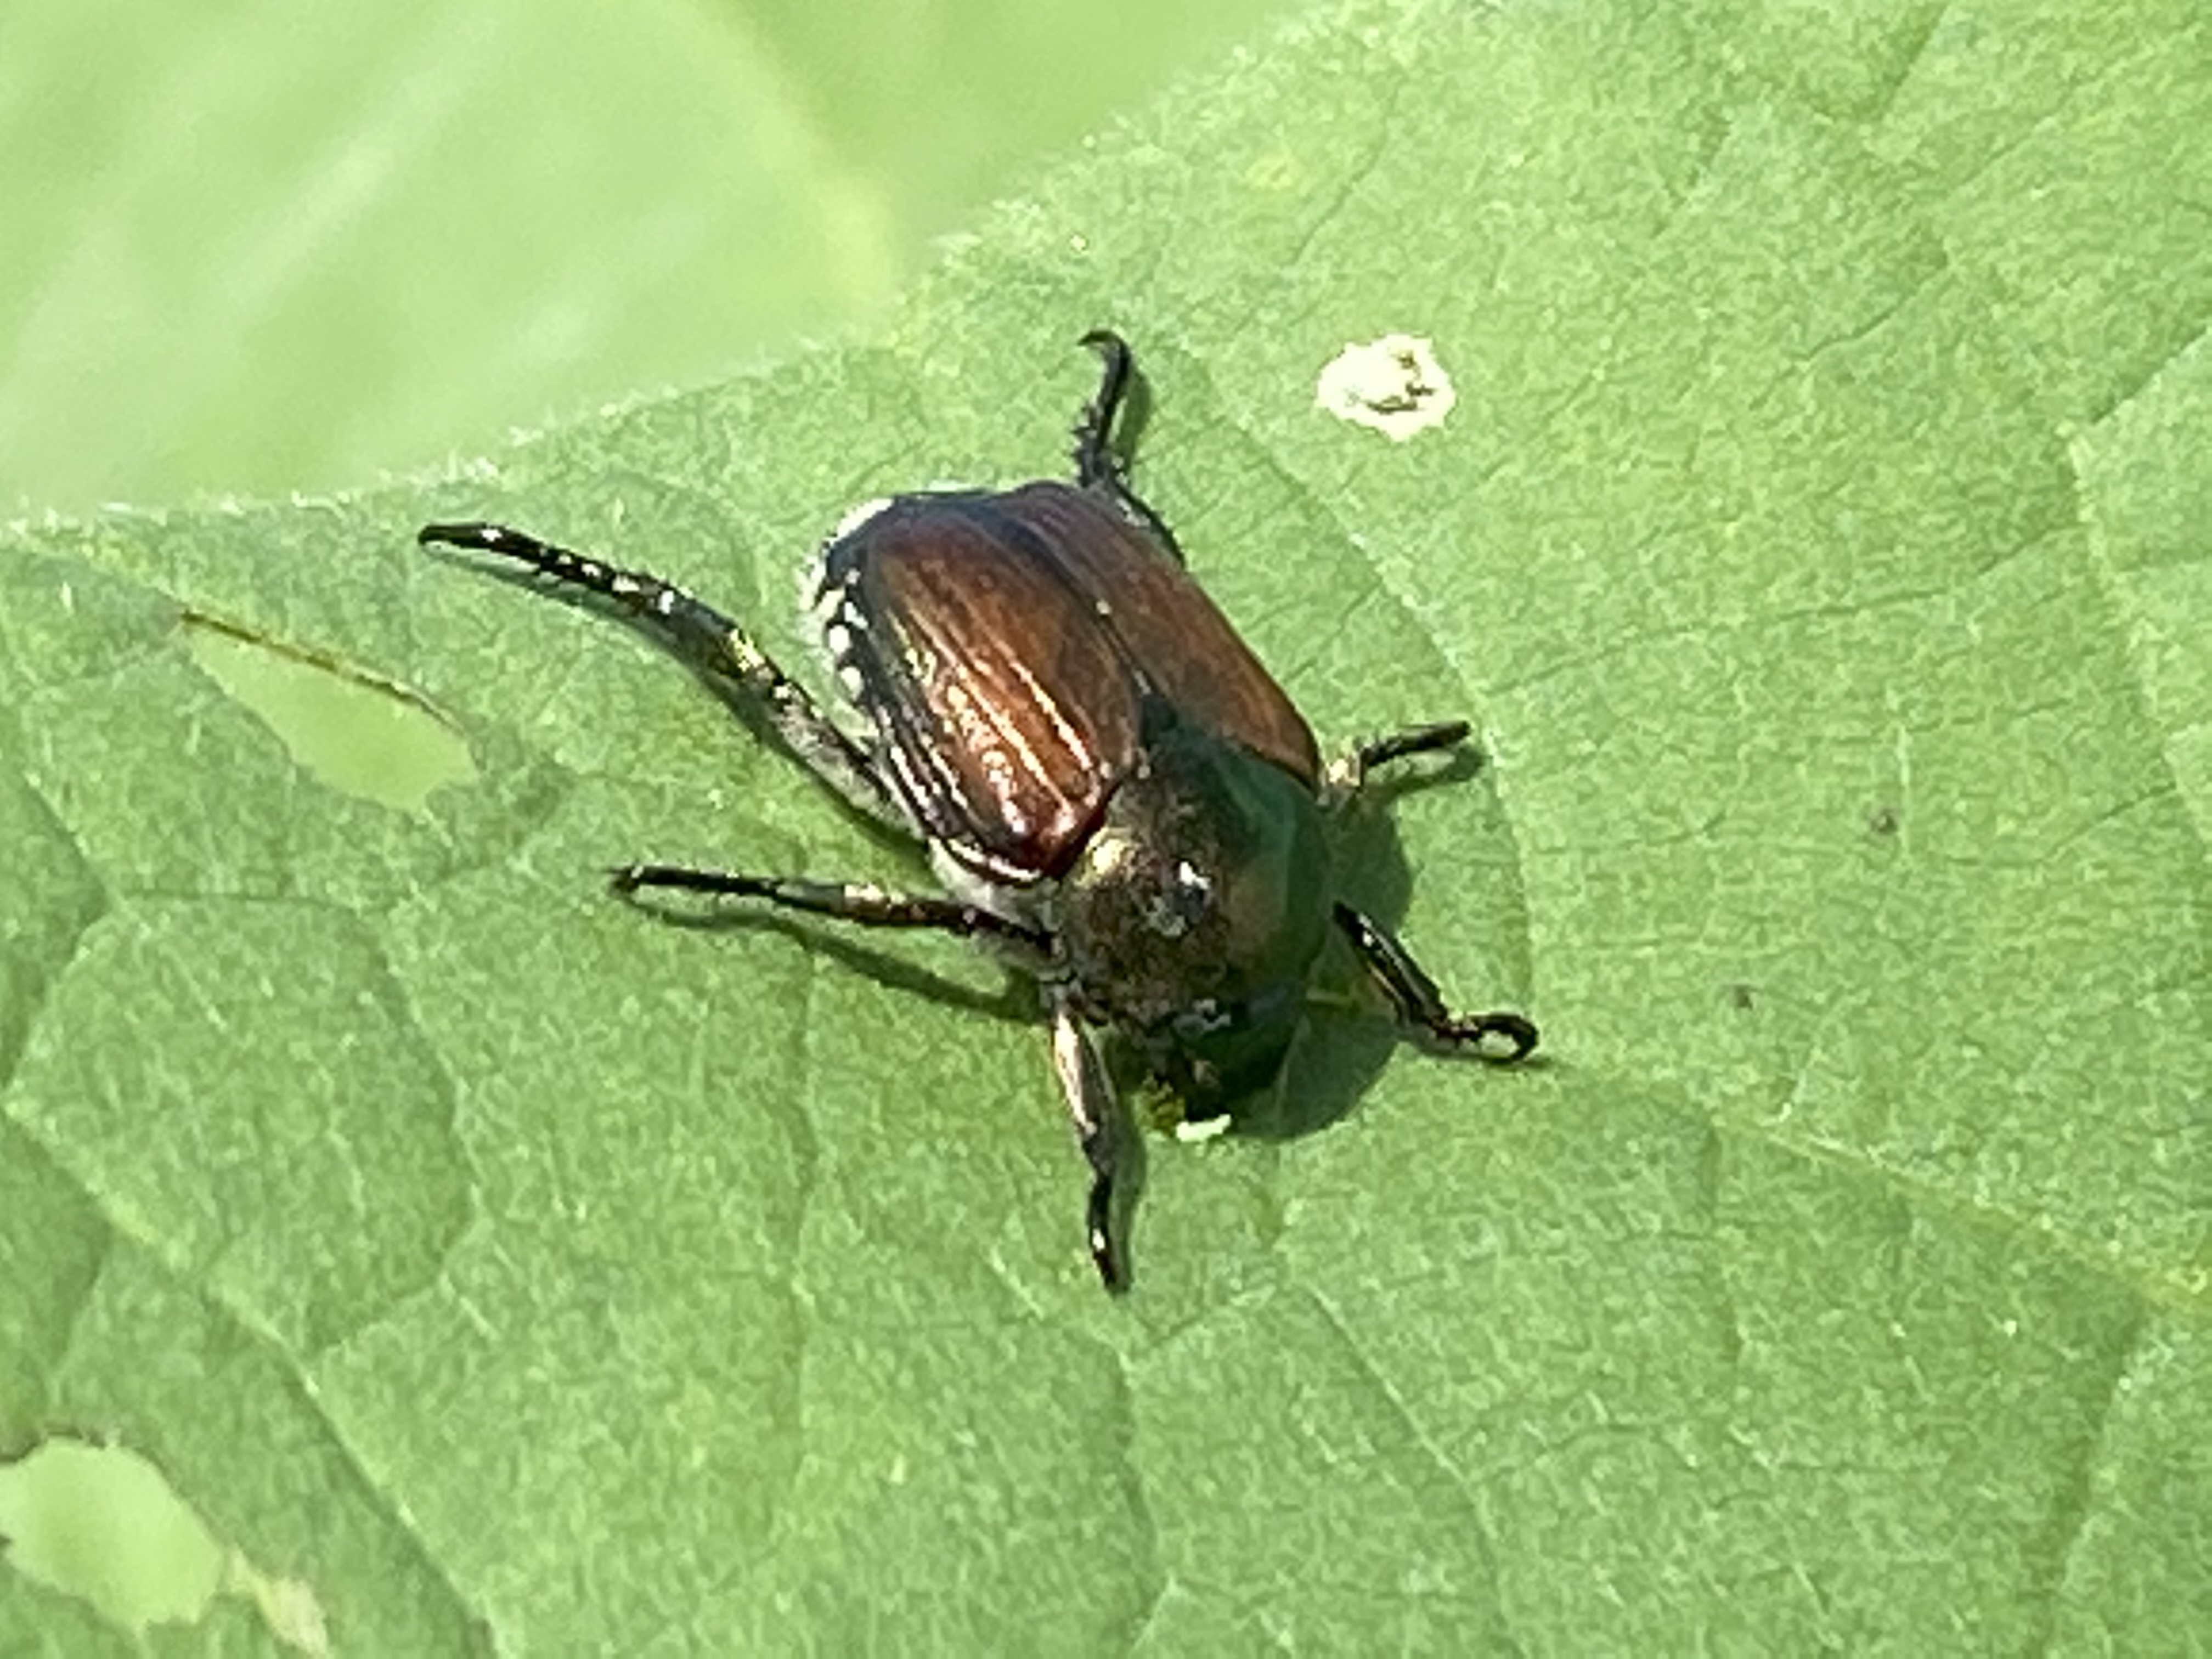
Japanese beetles started showing up a couple weeks ago. They will complete their life cycle over the next month. If they are getting into plants around the house, stay away from the beetle traps; they attract beetles that will lay eggs in grassy areas.
Weekly Rain Winner June 24-30
2021-07-01
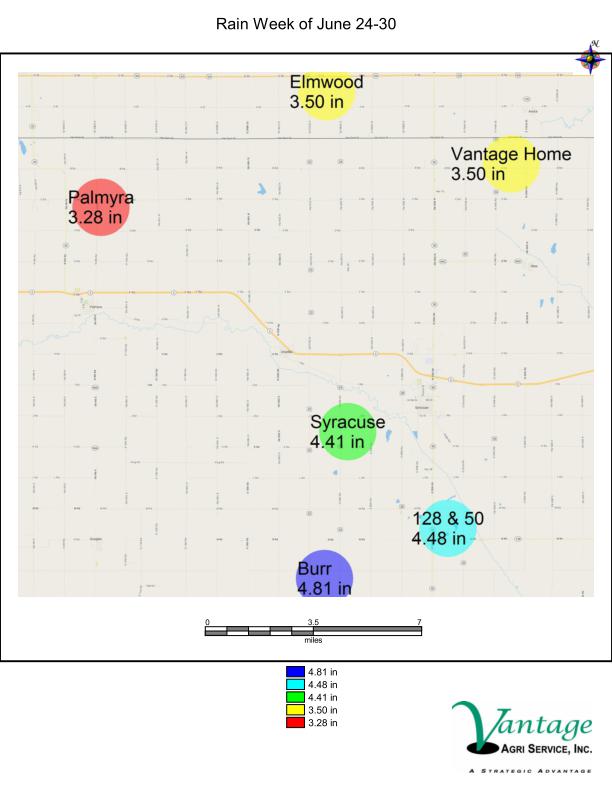
It looks like folks in the south part of the county are the winners for rain totals last week. The guys up north received a heavier rain on the 26th that looks like it soaked in well. We should be able to tell which rain events were more effective with the soil moisture probes in the coming week.
Palmer Amaranth
2021-06-30
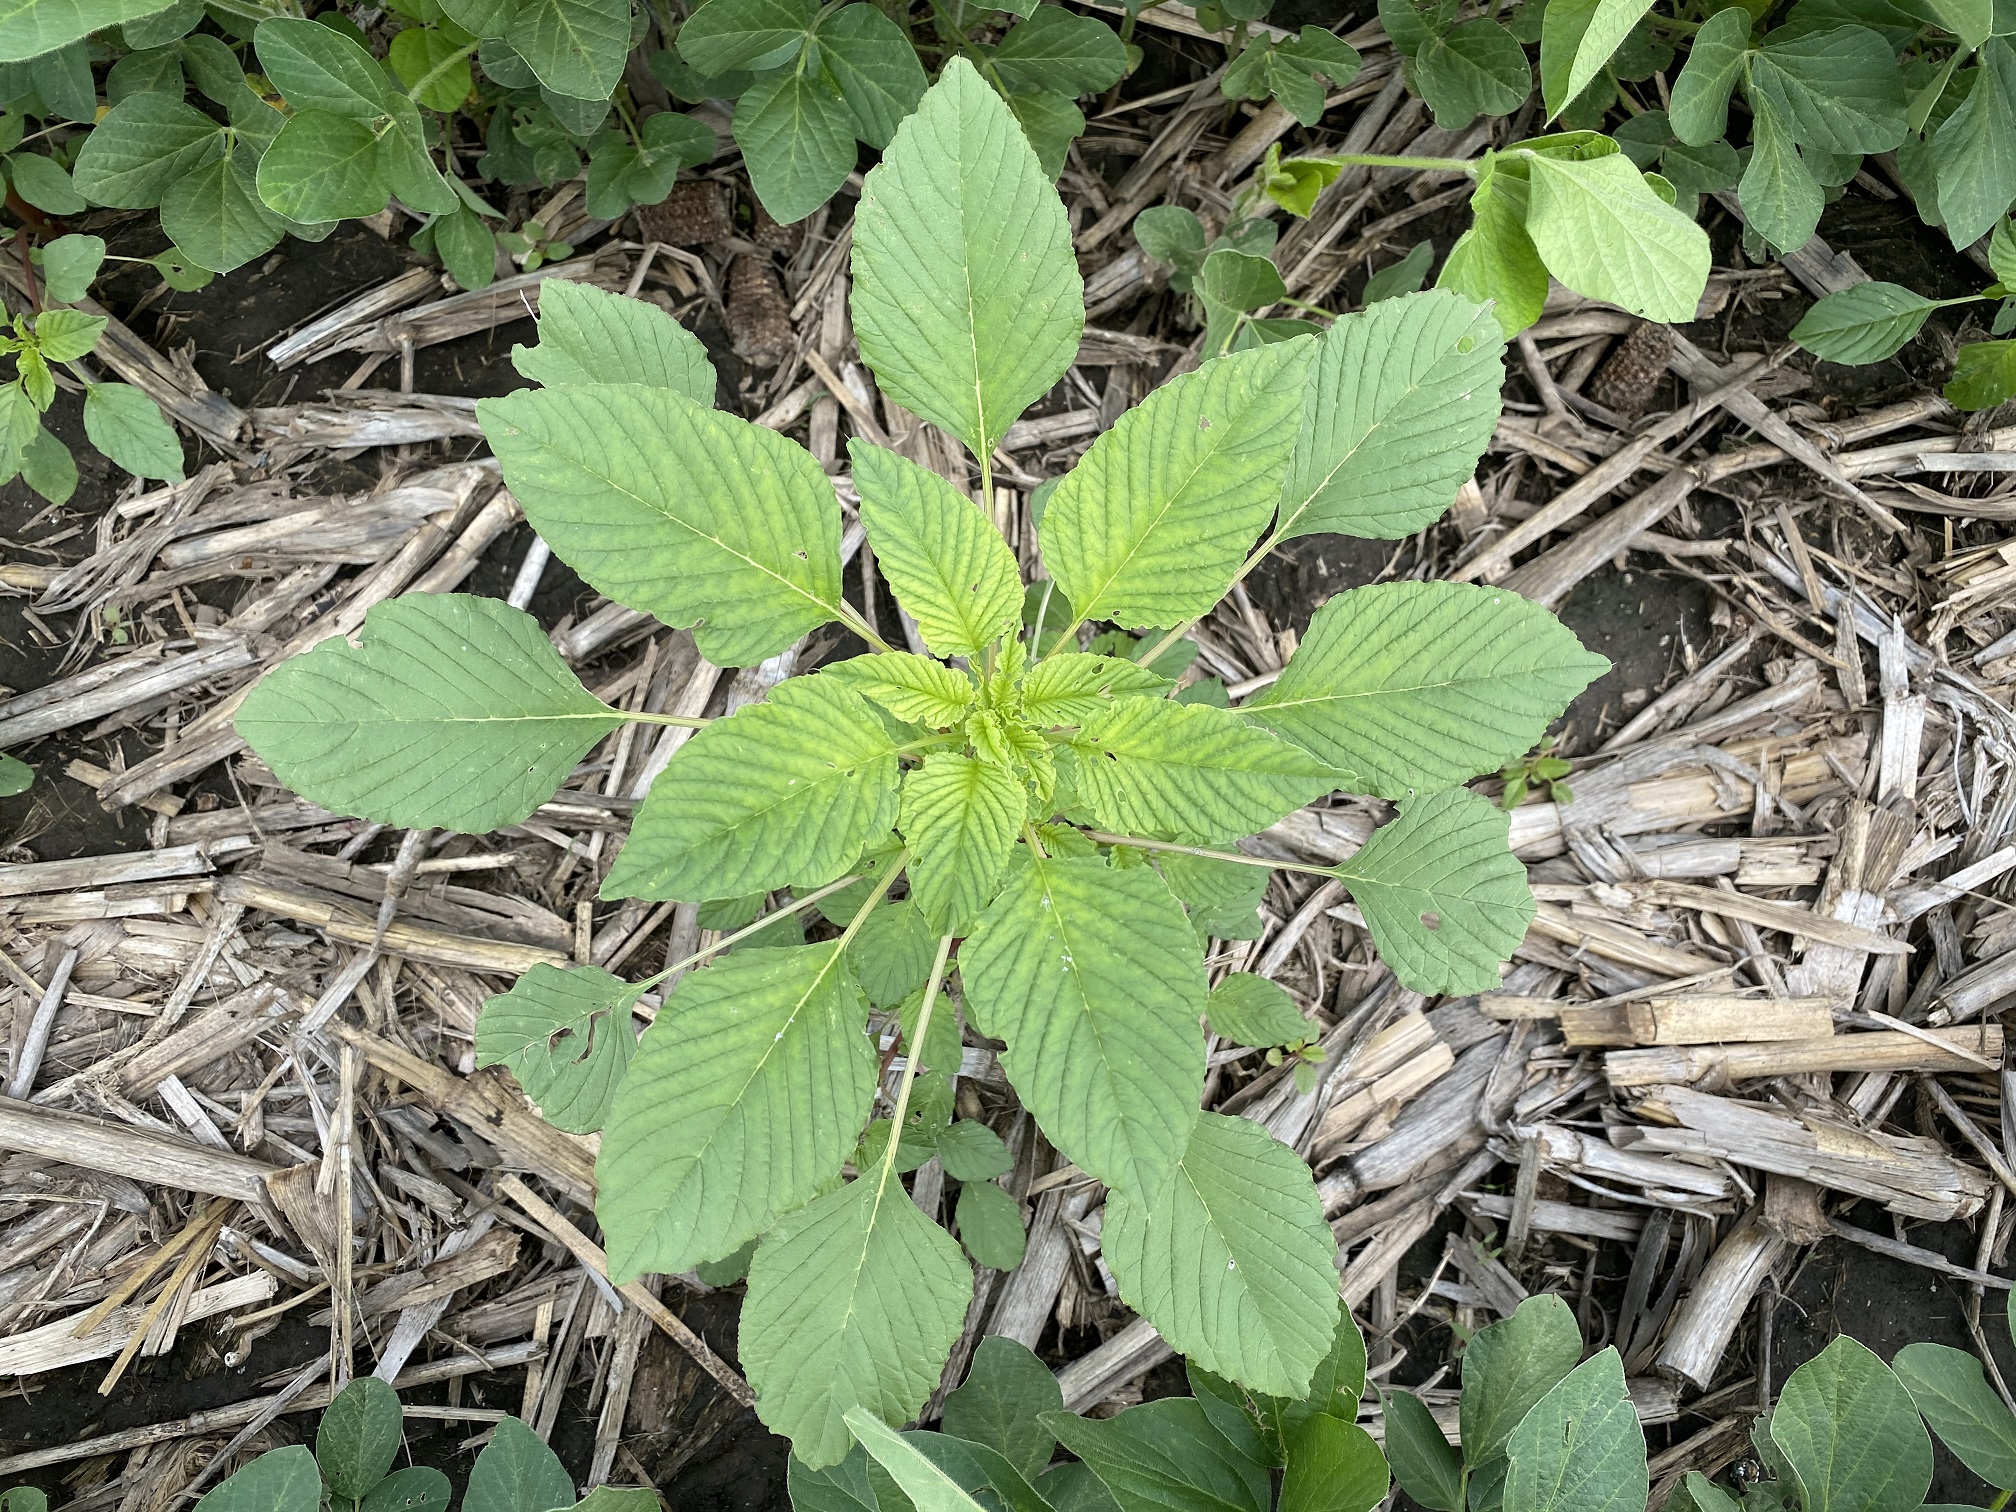
Snapped a photo the other day of Palmer Amaranth good enough to make a text book. Palmer continues to be a threat to fields in Southeast Nebraska. This shot came from a farm near Cook. First time Palmer has been observed in this field. Just a reminder always be on the lookout. Palmer can pop up anywhere.
Topdress Nitrogen Trial
2021-06-15
This summer we're taking a close look at Nitrogen use on eight different growers. We have side-by-side plots set up on 5 of the growers looking at: 1) Full Rate Fall NH3 vs. 3/4 Rate Fall NH3 with Urea top dress 2) Spring NH3 High Rate with Urea/AMS topdress vs. Spring NH3 with high rate Urea/AMS top dress (this field also has Full Rate NH3 check plots and low rate plots that we will analyze with yield data) 3) Full Rate Fall NH3 vs Full Rate NH3 with Top Dress Urea/AMS vs Full Rate Fall NH3 with a biological N fixing product 4) 60% Rate Spring Liquid with 40% Urea/AMS vs 40% Rate Spring Liquid with 60% Urea/AMS (there are check plots of high and low rates in this field) 5) Fall NH3 with Urea/AMS top dress vs Double Rate top dress 6) Full Rate Fall NH3 vs 40% Rate Fall NH3 with 60% Urea/AMS top dress 7) Full Rate NH3 vs 60% Rate Fall NH3 with 40% Urea/AMS top dress 8) Tracking N movement on a couple growers in an NRCS nutrient management program This study is NOT set up to determine the perfect form or rate of Nitrogen. We're simply trying to collect information to make guys aware of how nitrogen moves with local weather events and how plant respond to treatments.